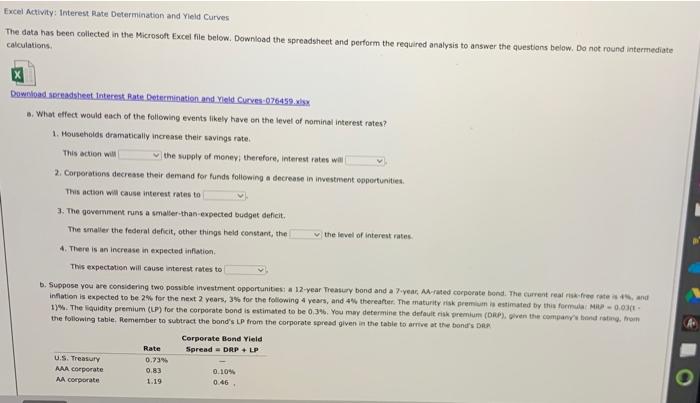
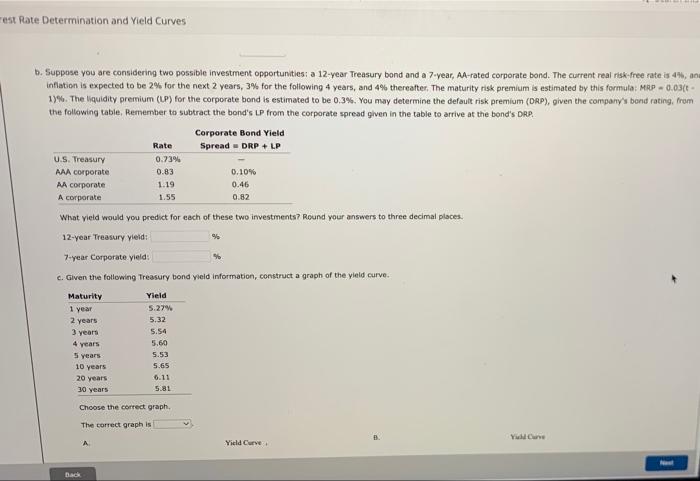
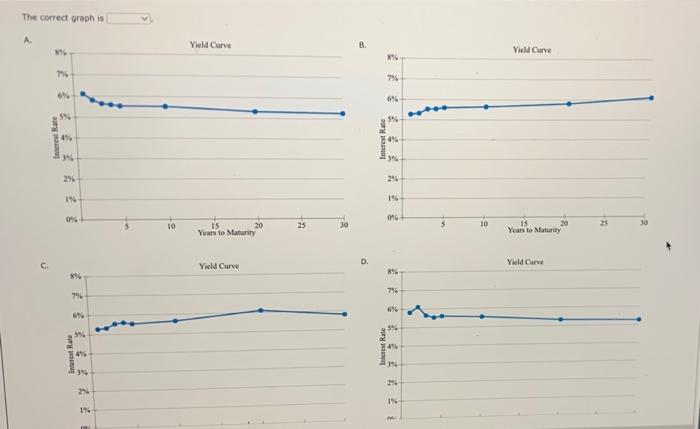
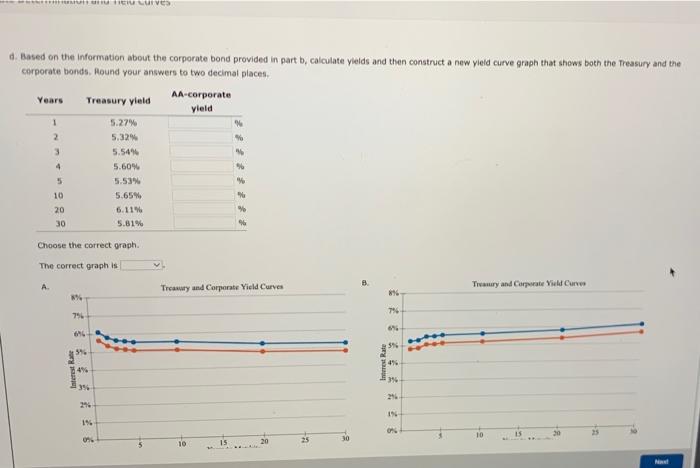
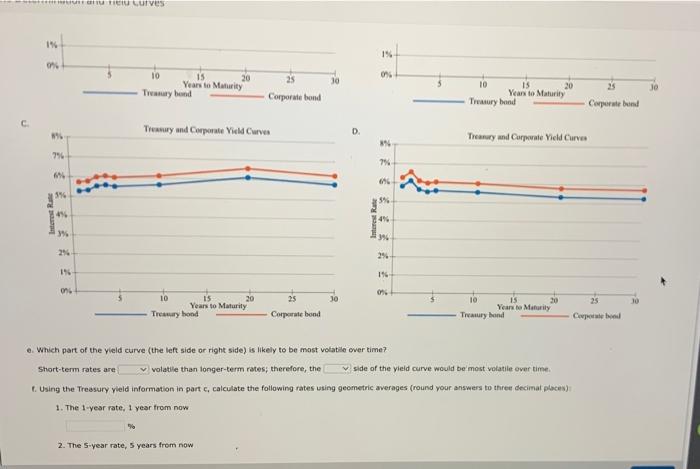
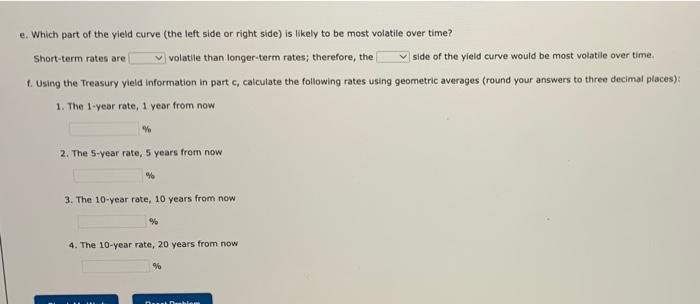
Excel Activity: Interest Rate Determination and Yield Curves The data has been collected in the Microsoft Excel file below. Download the spreadsheet and perform the required analysis to answer the questions below. Do not round intermediate calculations. Download spreadsheet Interest Rate Determination and Yield Curves-076459.xxx a. What effect would each of the following events likely have on the level of nominal interest rates? 1. Households dramatically increase their savings rate. This action will the supply of money; therefore, interest rates will 2. Corporations decrease their demand for funds following a decrease in investment opportunities. This action will cause interest rates to 3. The government runs a smaller-than-expected budget deficit. The smaller the federal deficit, other things held constant, the the level of interest rates. 4. There is an increase in expected inflation. This expectation will cause interest rates to b. Suppose you are considering two possible investment opportunities: a 12-year Treasury bond and a 7-year, AA-rated corporate bond. The current real risk-free rate is 4%, and inflation is expected to be 2% for the next 2 years, 3% for the following 4 years, and 4% thereafter. The maturity risk premium is estimated by this formula: MRP-0.03(1- 13%. The liquidity premium (LP) for the corporate bond is estimated to be 0.3%. You may determine the default risk premium (DRP), given the company's bond rating, from the following table. Remember to subtract the bond's LP from the corporate spread given in the table to arrive at the band's DRA Corporate Bond Yield Rate Spread DRP + LP U.S. Treasury 0.73% AAA corporate 0.83 0.10% AA corporate 1.19 0.46 est Rate Determination and Yield Curves b. Suppose you are considering two possible investment opportunities: a 12-year Treasury bond and a 7-year, AA-rated corporate bond. The current real risk-free rate is 4%, ana inflation is expected to be 2% for the next 2 years, 3% for the following 4 years, and 4% thereafter. The maturity risk premium is estimated by this formula: MRP -0.03(t- 1) %. The liquidity premium (LP) for the corporate bond is estimated to be 0.3%. You may determine the default risk premium (DRP), given the company's bond rating, from the following table. Remember to subtract the bond's LP from the corporate spread given in the table to arrive at the bond's DRP Corporate Bond Yield Rate Spread = DRP + LP U.S. Treasury 0.73% AAA corporate 0.83 0.10% AA corporate 1.19 0.46 A corporate 1.55 0.82 What yield would you predict for each of these two investments? Round your answers to three decimal places. 12-year Treasury yield: % 7-year Corporate yield: c. Given the following Treasury bond yield information, construct a graph of the yield curve. Maturity Yield 1 year 5.27% 2 years 5.32 3 years 5.54 4 years 5.60 5 years 5.53 10 years 5.65 20 years 6.11 30 years 5.81 Choose the correct graph, The correct graph is Yield Curve Back Yild Carve The correct graph is A. 8% 79 6% 5%- Interest Rate 22 84% 3% 2% IN 0% 8% 7% Interest Rate 3% 4% 2% 21- 1% ON 5 10 Yield Curve 15 Years to Maturity Yield Curve 20 25 30 B. D. Interest Rate Interest Rate 876 756 6% 5%- 4% 3% 2% 196- 0% 8% 7% 5% 4% 3% 2% 1% WA 10 Yield Curve 15 Years to Maturity Yield Curve 20 dan EU Curves d. Based on the information about the corporate bond provided in part b, calculate yields and then construct a new yield curve graph that shows both the Treasury and the corporate bonds. Round your answers to two decimal places. Years Treasury yield AA-corporate yield 1 5.27% 5.32% 5.54% 5.60% 5 5.53% 10 5.65% 20 6.11% 30 5.81% Choose the correct graph. The correct graph is A. Treasury and Corporate Yield Curves 8% 7%- 7% 6% 2 3 4 6% 5% 4% Interest Rate 3% 1% 0% V. Treasury and Corporate Yield Curves 20 634 8 Interest Rate 84% 3% 21 1%- 0% **** 10 C can ficio Curves 196- 1% 0% 10 0% 15 20 Years to Maturity 10 15 Years to Maturity Treasury bond Treasury bond Treasury and Corporate Vield Curves Treasury and Corporate Yield Curves1 8% 8% 7% 7% 6% 6% 556 5% 4% 4% 3% 3% 2% 2% 1% 1% 0% 0% 10 20 25 10 15 20 25 15 Years to Maturity Treasury bond Years to Maturity Treasury bond Corporate bond Corporate bood e. Which part of the yield curve (the left side or right side) is likely to be most volatile over time? side of the yield curve would be most volatile over time. volatile than longer-term rates; therefore, the Short-term rates are f. Using the Treasury yield information in part c, calculate the following rates using geometric averages (round your answers to three decimal places) 1. The 1-year rate, 1 year from now 2. The 5-year rate, 5 years from now Interest Rate 25 Corporate bond 30 D. Interest Rate 20 25 Corporate bond 30 30 e. Which part of the yield curve (the left side or right side) is likely to be most volatile over time? Short-term rates are volatile than longer-term rates; therefore, the side of the yield curve would be most volatile over time. f. Using the Treasury yield information in part c, calculate the following rates using geometric averages (round your answers to three decimal places): 1. The 1-year rate, 1 year from now % 2. The 5-year rate, 5 years from now. % 3. The 10-year rate, 10 years from now % 4. The 10-year rate, 20 years from now Das Drablem Excel Activity: Interest Rate Determination and Yield Curves The data has been collected in the Microsoft Excel file below. Download the spreadsheet and perform the required analysis to answer the questions below. Do not round intermediate calculations. Download spreadsheet Interest Rate Determination and Yield Curves-076459.xxx a. What effect would each of the following events likely have on the level of nominal interest rates? 1. Households dramatically increase their savings rate. This action will the supply of money; therefore, interest rates will 2. Corporations decrease their demand for funds following a decrease in investment opportunities. This action will cause interest rates to 3. The government runs a smaller-than-expected budget deficit. The smaller the federal deficit, other things held constant, the the level of interest rates. 4. There is an increase in expected inflation. This expectation will cause interest rates to b. Suppose you are considering two possible investment opportunities: a 12-year Treasury bond and a 7-year, AA-rated corporate bond. The current real risk-free rate is 4%, and inflation is expected to be 2% for the next 2 years, 3% for the following 4 years, and 4% thereafter. The maturity risk premium is estimated by this formula: MRP-0.03(1- 13%. The liquidity premium (LP) for the corporate bond is estimated to be 0.3%. You may determine the default risk premium (DRP), given the company's bond rating, from the following table. Remember to subtract the bond's LP from the corporate spread given in the table to arrive at the band's DRA Corporate Bond Yield Rate Spread DRP + LP U.S. Treasury 0.73% AAA corporate 0.83 0.10% AA corporate 1.19 0.46 est Rate Determination and Yield Curves b. Suppose you are considering two possible investment opportunities: a 12-year Treasury bond and a 7-year, AA-rated corporate bond. The current real risk-free rate is 4%, ana inflation is expected to be 2% for the next 2 years, 3% for the following 4 years, and 4% thereafter. The maturity risk premium is estimated by this formula: MRP -0.03(t- 1) %. The liquidity premium (LP) for the corporate bond is estimated to be 0.3%. You may determine the default risk premium (DRP), given the company's bond rating, from the following table. Remember to subtract the bond's LP from the corporate spread given in the table to arrive at the bond's DRP Corporate Bond Yield Rate Spread = DRP + LP U.S. Treasury 0.73% AAA corporate 0.83 0.10% AA corporate 1.19 0.46 A corporate 1.55 0.82 What yield would you predict for each of these two investments? Round your answers to three decimal places. 12-year Treasury yield: % 7-year Corporate yield: c. Given the following Treasury bond yield information, construct a graph of the yield curve. Maturity Yield 1 year 5.27% 2 years 5.32 3 years 5.54 4 years 5.60 5 years 5.53 10 years 5.65 20 years 6.11 30 years 5.81 Choose the correct graph, The correct graph is Yield Curve Back Yild Carve The correct graph is A. 8% 79 6% 5%- Interest Rate 22 84% 3% 2% IN 0% 8% 7% Interest Rate 3% 4% 2% 21- 1% ON 5 10 Yield Curve 15 Years to Maturity Yield Curve 20 25 30 B. D. Interest Rate Interest Rate 876 756 6% 5%- 4% 3% 2% 196- 0% 8% 7% 5% 4% 3% 2% 1% WA 10 Yield Curve 15 Years to Maturity Yield Curve 20 dan EU Curves d. Based on the information about the corporate bond provided in part b, calculate yields and then construct a new yield curve graph that shows both the Treasury and the corporate bonds. Round your answers to two decimal places. Years Treasury yield AA-corporate yield 1 5.27% 5.32% 5.54% 5.60% 5 5.53% 10 5.65% 20 6.11% 30 5.81% Choose the correct graph. The correct graph is A. Treasury and Corporate Yield Curves 8% 7%- 7% 6% 2 3 4 6% 5% 4% Interest Rate 3% 1% 0% V. Treasury and Corporate Yield Curves 20 634 8 Interest Rate 84% 3% 21 1%- 0% **** 10 C can ficio Curves 196- 1% 0% 10 0% 15 20 Years to Maturity 10 15 Years to Maturity Treasury bond Treasury bond Treasury and Corporate Vield Curves Treasury and Corporate Yield Curves1 8% 8% 7% 7% 6% 6% 556 5% 4% 4% 3% 3% 2% 2% 1% 1% 0% 0% 10 20 25 10 15 20 25 15 Years to Maturity Treasury bond Years to Maturity Treasury bond Corporate bond Corporate bood e. Which part of the yield curve (the left side or right side) is likely to be most volatile over time? side of the yield curve would be most volatile over time. volatile than longer-term rates; therefore, the Short-term rates are f. Using the Treasury yield information in part c, calculate the following rates using geometric averages (round your answers to three decimal places) 1. The 1-year rate, 1 year from now 2. The 5-year rate, 5 years from now Interest Rate 25 Corporate bond 30 D. Interest Rate 20 25 Corporate bond 30 30 e. Which part of the yield curve (the left side or right side) is likely to be most volatile over time? Short-term rates are volatile than longer-term rates; therefore, the side of the yield curve would be most volatile over time. f. Using the Treasury yield information in part c, calculate the following rates using geometric averages (round your answers to three decimal places): 1. The 1-year rate, 1 year from now % 2. The 5-year rate, 5 years from now. % 3. The 10-year rate, 10 years from now % 4. The 10-year rate, 20 years from now Das Drablem