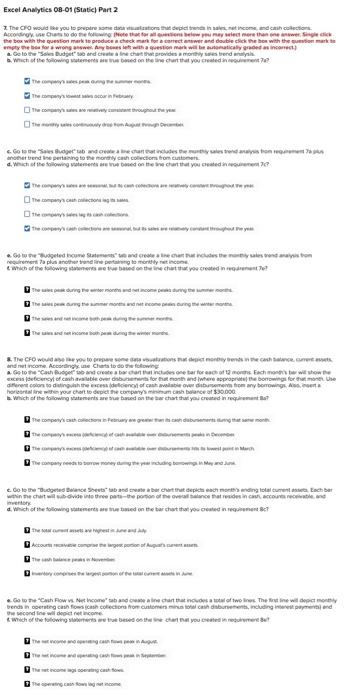
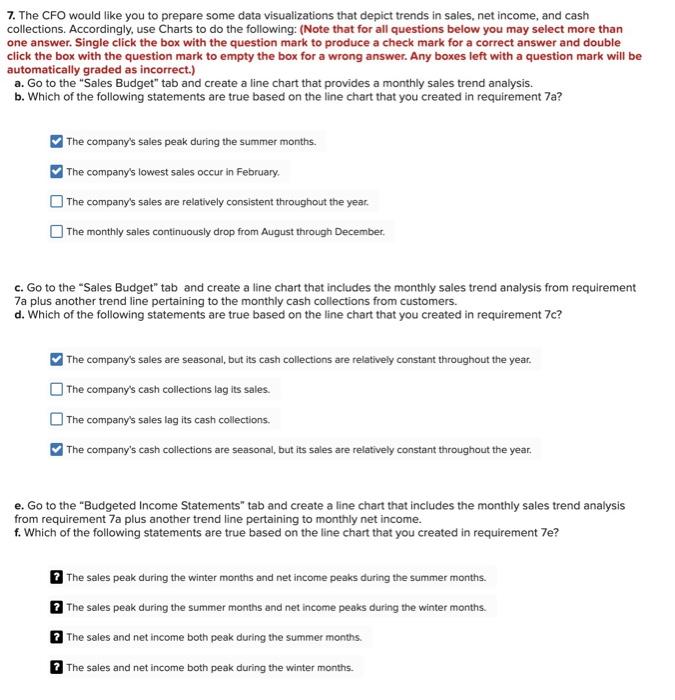
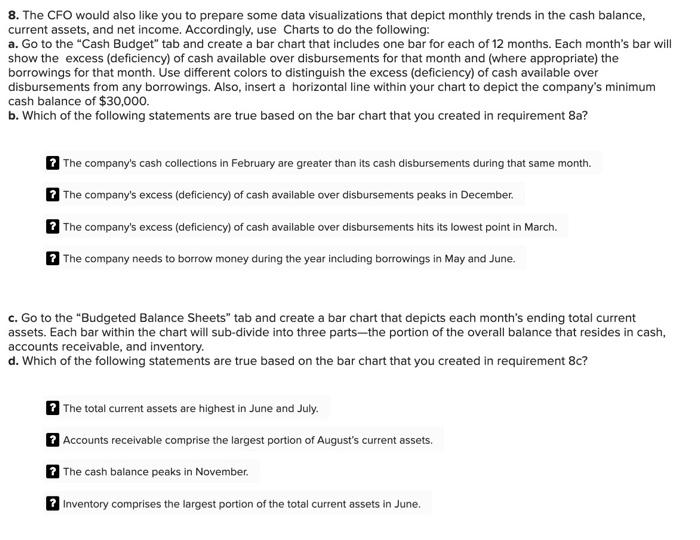
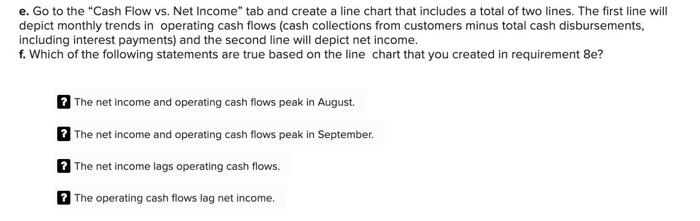
Excel Analyties 08-01 (Static) Part 2 titeetitiv the Gecond line will depict rept iecoire. 7. The CFO would like you to prepare some data visualizations that depict trends in sales, net income, and cash collections. Accordingly, use Charts to do the following: (Note that for all questions below you may select more than one answer. Single click the box with the question mark to produce a check mark for a correct answer and double click the box with the question mark to empty the box for a wrong answer. Any boxes left with a question mark will be automatically graded as incorrect.) a. Go to the "Sales Budget" tab and create a line chart that provides a monthly sales trend analysis. b. Which of the following statements are true based on the line chart that you created in requirement 7a ? The company's sales peak during the summer months. The company's lowest sales occur in February. The company's sales are relatively consistent throughout the year. The monthly sales continuously drop from August through December. c. Go to the "Sales Budget" tab and create a line chart that includes the monthly sales trend analysis from requirement 7 a plus another trend line pertaining to the monthly cash collections from customers. d. Which of the following statements are true based on the line chart that you created in requirement 7c ? The company's sales are seasonal, but its cash collections are relatively constant throughout the year. The company's cash collections lag its sales. The company's sales lag its cash collections. The company's cash collections are seasonal, but its sales are relatively constant throughout the year. e. Go to the "Budgeted Income Statements" tab and create a line chart that includes the monthly sales trend analysis from requirement 7 a plus another trend line pertaining to monthly net income. f. Which of the following statements are true based on the line chart that you created in requirement 7e ? The sales peak during the winter months and net income peaks during the summer months. ? The sales peak during the summer months and net income peaks during the winter months. The sales and net income both peak during the summer months. The sales and net income both peak during the winter months. 8. The CFO would also like you to prepare some data visualizations that depict monthly trends in the cash balance, current assets, and net income. Accordingly, use Charts to do the following: a. Go to the "Cash Budget" tab and create a bar chart that includes one bar for each 12 months. Each month's bar will show the excess (deficiency) of cash available over disbursements for that month and (where appropriate) the borrowings for that month. Use different colors to distinguish the excess (deficiency) of cash available over disbursements from any borrowings. Also, insert a horizontal line within your chart to depict the company's minimum cash balance of $30,000. b. Which of the following statements are true based on the bar chart that you created in requirement 8a ? The company's cash collections in February are greater than its cash disbursements during that same month. ? The company's excess (deficiency) of cash available over disbursements peaks in December. ? The company's excess (deficiency) of cash available over disbursements hits its lowest point in March. The company needs to borrow money during the year including borrowings in May and June. c. Go to the "Budgeted Balance Sheets" tab and create a bar chart that depicts each month's ending total current assets. Each bar within the chart will sub-divide into three parts-the portion of the overall balance that resides in cash, accounts receivable, and inventory. d. Which of the following statements are true based on the bar chart that you created in requirement 8c ? The total current assets are highest in June and July. Accounts receivable comprise the largest portion of August's current assets. ? The cash balance peaks in November. Inventory comprises the largest portion of the total current assets in June. e. Go to the "Cash Flow vs. Net Income" tab and create a line chart that includes a total of two lines. The first line will depict monthly trends in operating cash flows (cash collections from customers minus total cash disbursements, including interest payments) and the second line will depict net income. f. Which of the following statements are true based on the line chart that you created in requirement 8e ? The net income and operating cash flows peak in August. The net income and operating cash flows peak in September. The net income lags operating cash flows. The operating cash flows lag net income. Excel Analyties 08-01 (Static) Part 2 titeetitiv the Gecond line will depict rept iecoire. 7. The CFO would like you to prepare some data visualizations that depict trends in sales, net income, and cash collections. Accordingly, use Charts to do the following: (Note that for all questions below you may select more than one answer. Single click the box with the question mark to produce a check mark for a correct answer and double click the box with the question mark to empty the box for a wrong answer. Any boxes left with a question mark will be automatically graded as incorrect.) a. Go to the "Sales Budget" tab and create a line chart that provides a monthly sales trend analysis. b. Which of the following statements are true based on the line chart that you created in requirement 7a ? The company's sales peak during the summer months. The company's lowest sales occur in February. The company's sales are relatively consistent throughout the year. The monthly sales continuously drop from August through December. c. Go to the "Sales Budget" tab and create a line chart that includes the monthly sales trend analysis from requirement 7 a plus another trend line pertaining to the monthly cash collections from customers. d. Which of the following statements are true based on the line chart that you created in requirement 7c ? The company's sales are seasonal, but its cash collections are relatively constant throughout the year. The company's cash collections lag its sales. The company's sales lag its cash collections. The company's cash collections are seasonal, but its sales are relatively constant throughout the year. e. Go to the "Budgeted Income Statements" tab and create a line chart that includes the monthly sales trend analysis from requirement 7 a plus another trend line pertaining to monthly net income. f. Which of the following statements are true based on the line chart that you created in requirement 7e ? The sales peak during the winter months and net income peaks during the summer months. ? The sales peak during the summer months and net income peaks during the winter months. The sales and net income both peak during the summer months. The sales and net income both peak during the winter months. 8. The CFO would also like you to prepare some data visualizations that depict monthly trends in the cash balance, current assets, and net income. Accordingly, use Charts to do the following: a. Go to the "Cash Budget" tab and create a bar chart that includes one bar for each 12 months. Each month's bar will show the excess (deficiency) of cash available over disbursements for that month and (where appropriate) the borrowings for that month. Use different colors to distinguish the excess (deficiency) of cash available over disbursements from any borrowings. Also, insert a horizontal line within your chart to depict the company's minimum cash balance of $30,000. b. Which of the following statements are true based on the bar chart that you created in requirement 8a ? The company's cash collections in February are greater than its cash disbursements during that same month. ? The company's excess (deficiency) of cash available over disbursements peaks in December. ? The company's excess (deficiency) of cash available over disbursements hits its lowest point in March. The company needs to borrow money during the year including borrowings in May and June. c. Go to the "Budgeted Balance Sheets" tab and create a bar chart that depicts each month's ending total current assets. Each bar within the chart will sub-divide into three parts-the portion of the overall balance that resides in cash, accounts receivable, and inventory. d. Which of the following statements are true based on the bar chart that you created in requirement 8c ? The total current assets are highest in June and July. Accounts receivable comprise the largest portion of August's current assets. ? The cash balance peaks in November. Inventory comprises the largest portion of the total current assets in June. e. Go to the "Cash Flow vs. Net Income" tab and create a line chart that includes a total of two lines. The first line will depict monthly trends in operating cash flows (cash collections from customers minus total cash disbursements, including interest payments) and the second line will depict net income. f. Which of the following statements are true based on the line chart that you created in requirement 8e ? The net income and operating cash flows peak in August. The net income and operating cash flows peak in September. The net income lags operating cash flows. The operating cash flows lag net income