EXCEL Assignment
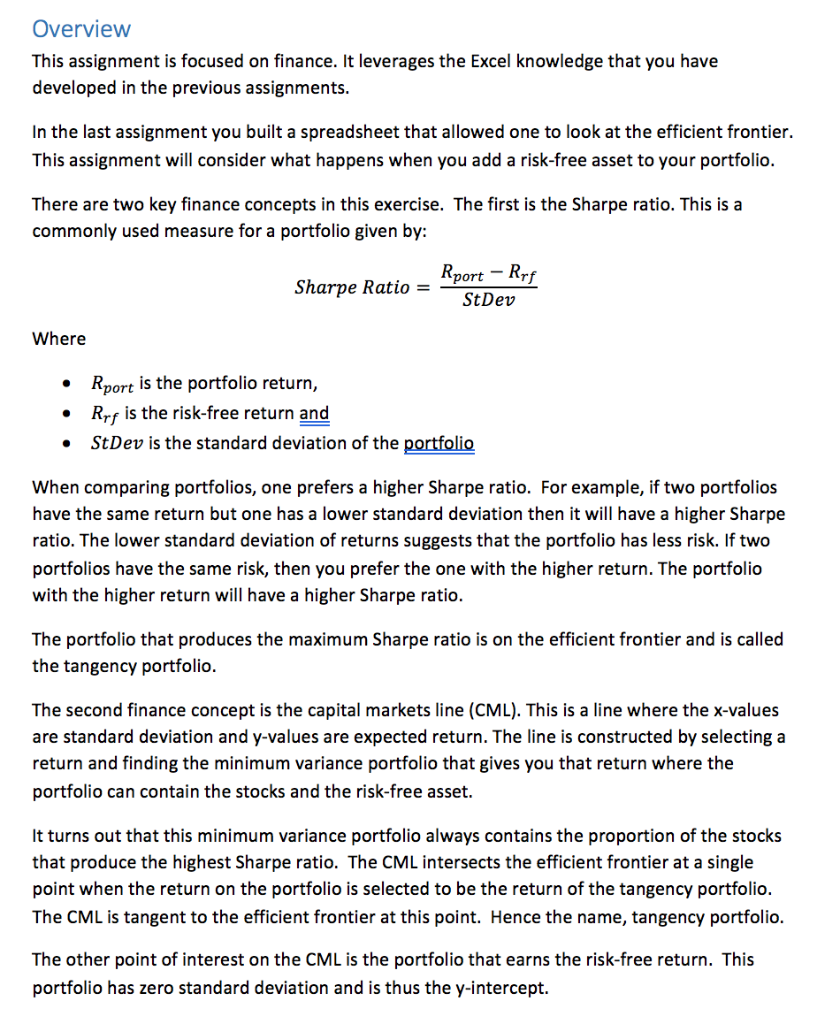
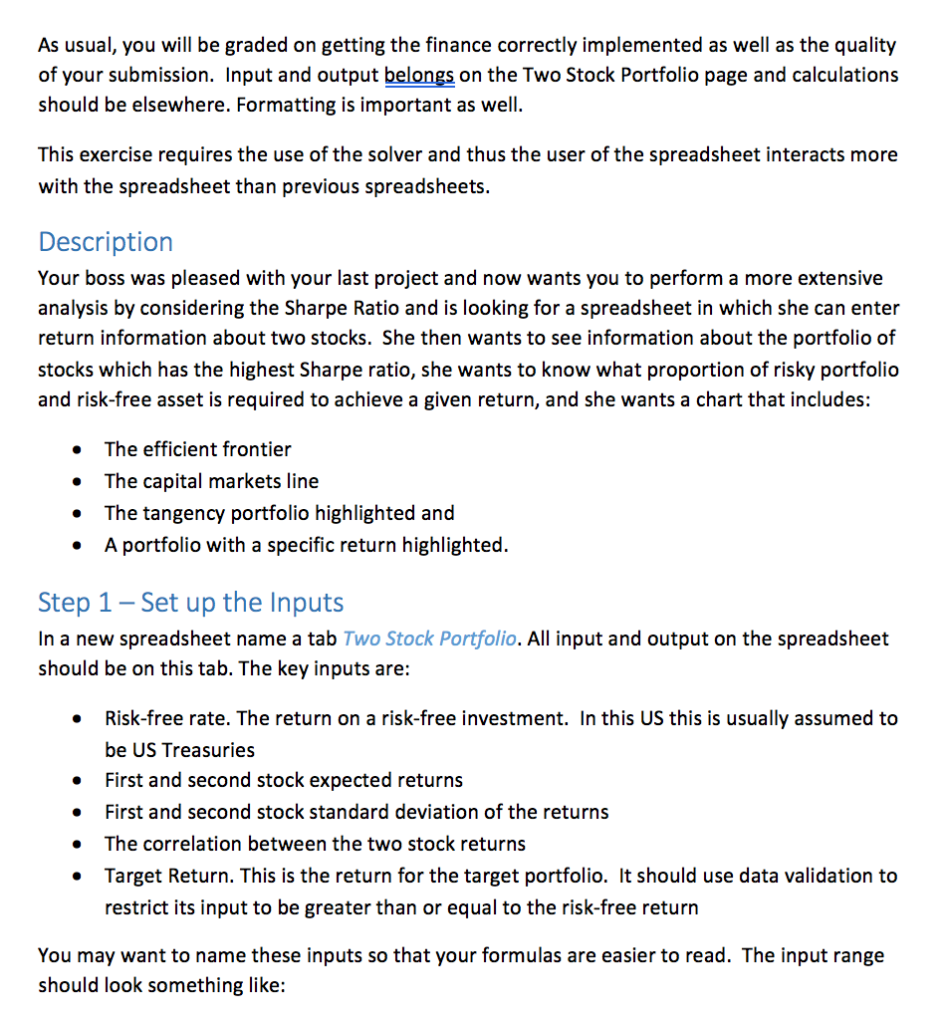
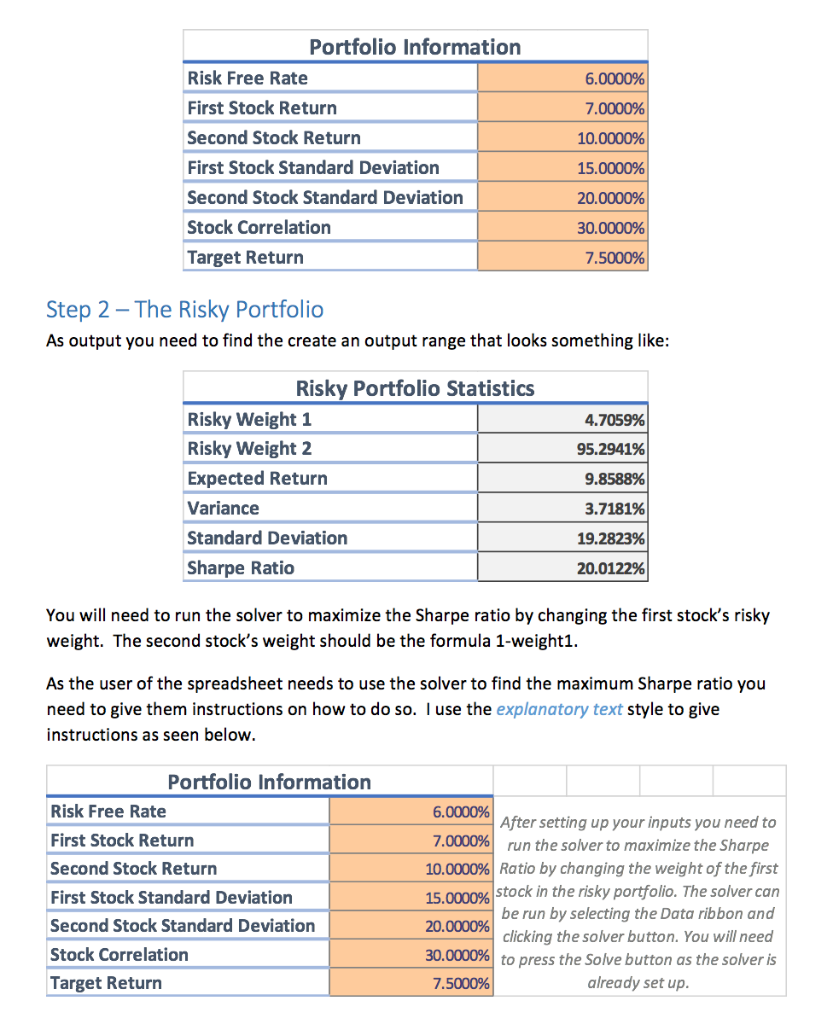
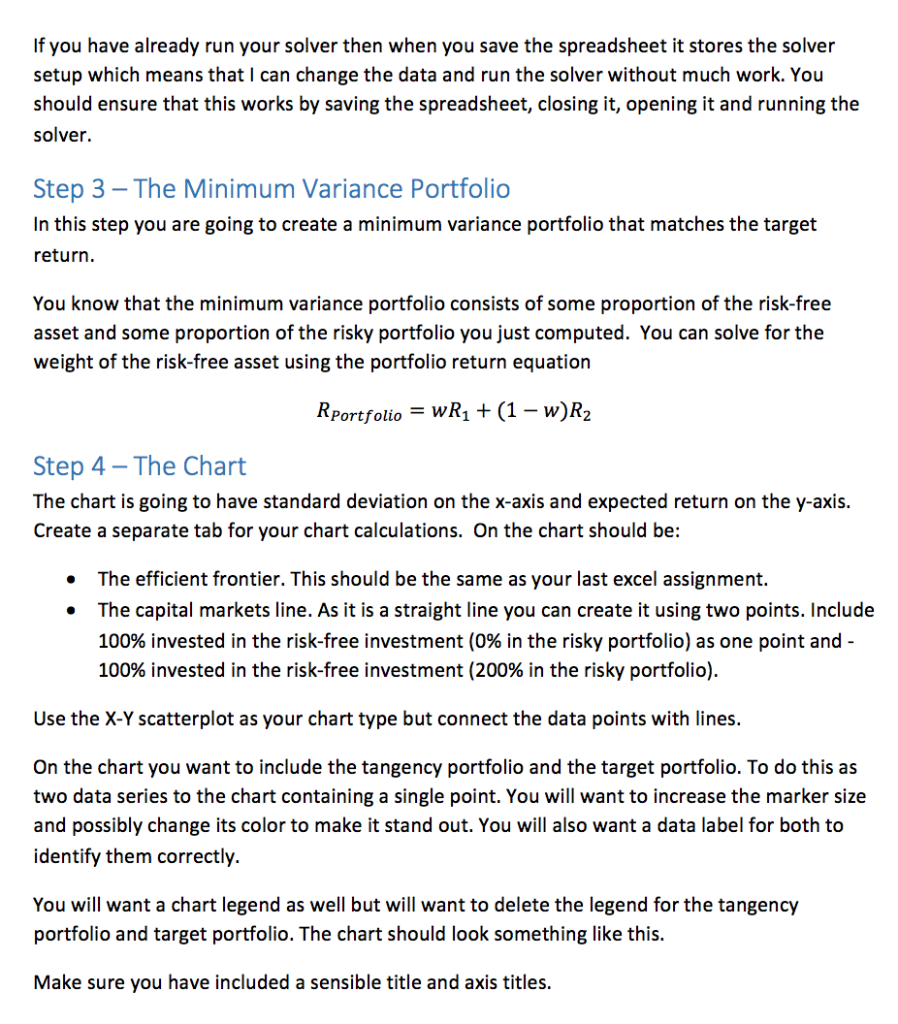
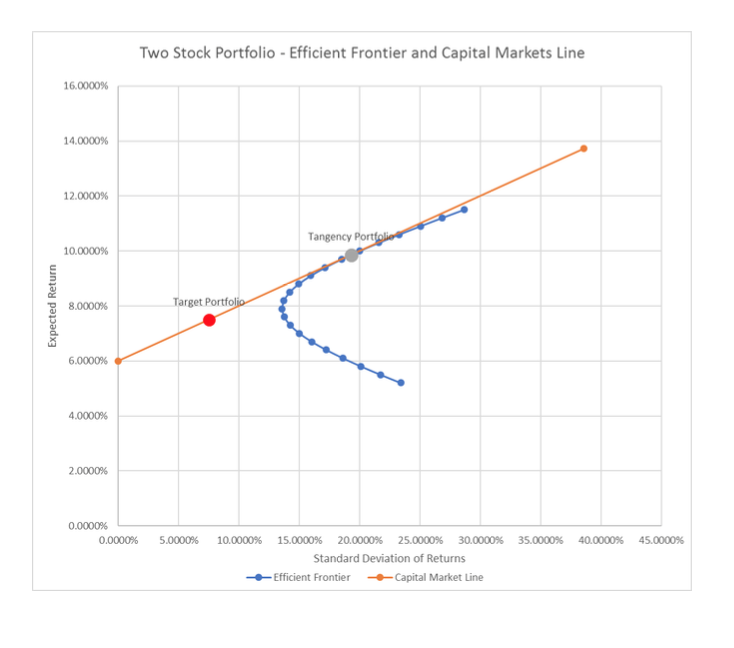
Overvievw This assignment is focused on finance. It leverages the Excel knowledge that you have developed in the previous assignments In the last assignment you built a spreadsheet that allowed one to look at the efficient frontier. This assignment will consider what happens when you add a risk-free asset to your portfolio. There are two key finance concepts in this exercise. The first is the Sharpe ratio. This is a commonly used measure for a portfolio given by: port Krf StDev Sharpe Ratio - Rport is the portfolio return, Rrf is the risk-free return and StDev is the standard deviation of the portfolio When comparing portfolios, one prefers a higher Sharpe ratio. For example, if two portfolios have the same return but one has a lower standard deviation then it will have a higher Sharpe ratio. The lower standard deviation of returns suggests that the portfolio has less risk. If two portfolios have the same risk, then you prefer the one with the higher return. The portfolio with the higher return will have a higher Sharpe ratio. The portfolio that produces the maximum Sharpe ratio is on the efficient frontier and is called the tangency portfolio The second finance concept is the capital markets line (CML). This is a line where the x-values are standard deviation and y-values are expected return. The line is constructed by selecting a return and finding the minimum variance portfolio that gives you that return where the portfolio can contain the stocks and the risk-free asset. It turns out that this minimum variance portfolio always contains the proportion of the stocks that produce the highest Sharpe ratio. The CML intersects the efficient frontier at a single point when the return on the portfolio is selected to be the return of the tangency portfolio. The CML is tangent to the efficient frontier at this point. Hence the name, tangency portfolio. The other point of interest on the CML is the portfolio that earns the risk-free return. This portfolio has zero standard deviation and is thus the y-intercept. As usual, you will be graded on getting the finance correctly implemented as well as the quality of your submission. Input and output belongs on the Two Stock Portfolio page and calculations should be elsewhere. Formatting is important as well. This exercise requires the use of the solver and thus the user of the spreadsheet interacts more with the spreadsheet than previous spreadsheets. Description Your boss was pleased with your last project and now wants you to perform a more extensive analysis by considering the Sharpe Ratio and is looking for a spreadsheet in which she can enter return information about two stocks. She then wants to see information about the portfolio of stocks which has the highest Sharpe ratio, she wants to know what proportion of risky portfolio and risk-free asset is required to achieve a given return, and she wants a chart that includes: e The efficient frontier The capital markets line . The tangency portfolio highlighted and A portfolio with a specific return highlighted. Step 1 - Set up the Inputs In a new spreadsheet name a tab Two Stock Portfolio. All input and output on the spreadsheet should be on this tab. The key inputs are: Risk-free rate. The return on a risk-free investment. In this US this is usually assumed to be US Treasuries First and second stock expected returns First and second stock standard deviation of the returns e The correlation between the two stock returns Target Return. This is the return for the target portfolio. It should use data validation to restrict its input to be greater than or equal to the risk-free return You may want to name these inputs so that your formulas are easier to read. The input range should look something like: Portfolio Information Risk Free Rate First Stock Return Second Stock Return First Stock Standard Deviation Second Stock Standard Deviation Stock Correlation Target Return 10.0000% 15.0000% 20.0000% 30.0000% 7.5000% Step 2 - The Risky Portfolio As output you need to find the create an output range that looks something like Risky Portfolio Statistics Risky Weight 1 Risky Weight 2 Expected Return Variance Standard Deviation Sharpe Ratio 4.7059% 95.2941% 9.8588% 3.7181% 19.2823% 20.0122% You will need to run the solver to maximize the Sharpe ratio by changing the first stock's risky weight. The second stock's weight should be the formula 1-weight1. As the user of the spreadsheet needs to use the solver to find the maximum Sharpe ratio you need to give them instructions on how to do so. I use the explanatory text style to give instructions as seen below Portfolio Information Risk Free Rate First Stock Return Second Stock Return First Stock Standard Deviation Second Stock Standard Deviation Stock Correlation Target Return 6.0000% After setting up your inputs you need to 7.0000%) run the solver to maximize the Sharpe 10.0000%) Ratio by changing the weight of the first 15.0000% stock in the risky portfolio. The solver can be run by selecting the Data ribbon and clicking the solver button.You will need to press the Solve button as the solver is 20.0000% already set up 7.5000% If you have already run your solver then when you save the spreadsheet it stores the solver setup which means that I can change the data and run the solver without much work. You should ensure that this works by saving the spreadsheet, closing it, opening it and running the solver. Step 3- The Minimum Variance Portfolio In this step you are going to create a minimum variance portfolio that matches the target return. You know that the minimum variance portfolio consists of some proportion of the risk-free asset and some proportion of the risky portfolio you just computed. You can solve for the weight of the risk-free asset using the portfolio return equation Portfolio = WR1 + (1-w)R2 Step 4 The Chart The chart is going to have standard deviation on the x-axis and expected return on the y-axis Create a separate tab for your chart calculations. On the chart should be: The efficient frontier. This should be the same as your last excel assignment. The capital markets line. As it is a straight line you can create it using two points. Include 100% invested in the risk-free investment (0% in the risky portfolio) as one point and 100% invested in the risk-free investment (200% in the risky portfolio). . Use the X-Y scatterplot as your chart type but connect the data points with lines. On the chart you want to include the tangency portfolio and the target portfolio. To do this as two data series to the chart containing a single point. You will want to increase the marker size and possibly change its color to make it stand out. You will also want a data label for both to identify them correctly. You will want a chart legend as well but will want to delete the legend for the tangency portfolio and target portfolio. The chart should look something like this. Make sure you have included a sensible title and axis titles Two Stock Portfolio-Efficient Frontier and Capital Markets Line 16.0000% 14.0000% 12.0000% Tangency Portfolie 10.0000% Target Portfo 8.0000% 6.0000% 4.0000% 2.000096 0.000096 0.0000% 5.0000% 10.0000% 15.0000% 20.0000% 25.0000% 30.0000% 3S0000% 4S0000% 400000% Standard Deviation of Returns Efficient Frontier -+-Capital Market Line Overvievw This assignment is focused on finance. It leverages the Excel knowledge that you have developed in the previous assignments In the last assignment you built a spreadsheet that allowed one to look at the efficient frontier. This assignment will consider what happens when you add a risk-free asset to your portfolio. There are two key finance concepts in this exercise. The first is the Sharpe ratio. This is a commonly used measure for a portfolio given by: port Krf StDev Sharpe Ratio - Rport is the portfolio return, Rrf is the risk-free return and StDev is the standard deviation of the portfolio When comparing portfolios, one prefers a higher Sharpe ratio. For example, if two portfolios have the same return but one has a lower standard deviation then it will have a higher Sharpe ratio. The lower standard deviation of returns suggests that the portfolio has less risk. If two portfolios have the same risk, then you prefer the one with the higher return. The portfolio with the higher return will have a higher Sharpe ratio. The portfolio that produces the maximum Sharpe ratio is on the efficient frontier and is called the tangency portfolio The second finance concept is the capital markets line (CML). This is a line where the x-values are standard deviation and y-values are expected return. The line is constructed by selecting a return and finding the minimum variance portfolio that gives you that return where the portfolio can contain the stocks and the risk-free asset. It turns out that this minimum variance portfolio always contains the proportion of the stocks that produce the highest Sharpe ratio. The CML intersects the efficient frontier at a single point when the return on the portfolio is selected to be the return of the tangency portfolio. The CML is tangent to the efficient frontier at this point. Hence the name, tangency portfolio. The other point of interest on the CML is the portfolio that earns the risk-free return. This portfolio has zero standard deviation and is thus the y-intercept. As usual, you will be graded on getting the finance correctly implemented as well as the quality of your submission. Input and output belongs on the Two Stock Portfolio page and calculations should be elsewhere. Formatting is important as well. This exercise requires the use of the solver and thus the user of the spreadsheet interacts more with the spreadsheet than previous spreadsheets. Description Your boss was pleased with your last project and now wants you to perform a more extensive analysis by considering the Sharpe Ratio and is looking for a spreadsheet in which she can enter return information about two stocks. She then wants to see information about the portfolio of stocks which has the highest Sharpe ratio, she wants to know what proportion of risky portfolio and risk-free asset is required to achieve a given return, and she wants a chart that includes: e The efficient frontier The capital markets line . The tangency portfolio highlighted and A portfolio with a specific return highlighted. Step 1 - Set up the Inputs In a new spreadsheet name a tab Two Stock Portfolio. All input and output on the spreadsheet should be on this tab. The key inputs are: Risk-free rate. The return on a risk-free investment. In this US this is usually assumed to be US Treasuries First and second stock expected returns First and second stock standard deviation of the returns e The correlation between the two stock returns Target Return. This is the return for the target portfolio. It should use data validation to restrict its input to be greater than or equal to the risk-free return You may want to name these inputs so that your formulas are easier to read. The input range should look something like: Portfolio Information Risk Free Rate First Stock Return Second Stock Return First Stock Standard Deviation Second Stock Standard Deviation Stock Correlation Target Return 10.0000% 15.0000% 20.0000% 30.0000% 7.5000% Step 2 - The Risky Portfolio As output you need to find the create an output range that looks something like Risky Portfolio Statistics Risky Weight 1 Risky Weight 2 Expected Return Variance Standard Deviation Sharpe Ratio 4.7059% 95.2941% 9.8588% 3.7181% 19.2823% 20.0122% You will need to run the solver to maximize the Sharpe ratio by changing the first stock's risky weight. The second stock's weight should be the formula 1-weight1. As the user of the spreadsheet needs to use the solver to find the maximum Sharpe ratio you need to give them instructions on how to do so. I use the explanatory text style to give instructions as seen below Portfolio Information Risk Free Rate First Stock Return Second Stock Return First Stock Standard Deviation Second Stock Standard Deviation Stock Correlation Target Return 6.0000% After setting up your inputs you need to 7.0000%) run the solver to maximize the Sharpe 10.0000%) Ratio by changing the weight of the first 15.0000% stock in the risky portfolio. The solver can be run by selecting the Data ribbon and clicking the solver button.You will need to press the Solve button as the solver is 20.0000% already set up 7.5000% If you have already run your solver then when you save the spreadsheet it stores the solver setup which means that I can change the data and run the solver without much work. You should ensure that this works by saving the spreadsheet, closing it, opening it and running the solver. Step 3- The Minimum Variance Portfolio In this step you are going to create a minimum variance portfolio that matches the target return. You know that the minimum variance portfolio consists of some proportion of the risk-free asset and some proportion of the risky portfolio you just computed. You can solve for the weight of the risk-free asset using the portfolio return equation Portfolio = WR1 + (1-w)R2 Step 4 The Chart The chart is going to have standard deviation on the x-axis and expected return on the y-axis Create a separate tab for your chart calculations. On the chart should be: The efficient frontier. This should be the same as your last excel assignment. The capital markets line. As it is a straight line you can create it using two points. Include 100% invested in the risk-free investment (0% in the risky portfolio) as one point and 100% invested in the risk-free investment (200% in the risky portfolio). . Use the X-Y scatterplot as your chart type but connect the data points with lines. On the chart you want to include the tangency portfolio and the target portfolio. To do this as two data series to the chart containing a single point. You will want to increase the marker size and possibly change its color to make it stand out. You will also want a data label for both to identify them correctly. You will want a chart legend as well but will want to delete the legend for the tangency portfolio and target portfolio. The chart should look something like this. Make sure you have included a sensible title and axis titles Two Stock Portfolio-Efficient Frontier and Capital Markets Line 16.0000% 14.0000% 12.0000% Tangency Portfolie 10.0000% Target Portfo 8.0000% 6.0000% 4.0000% 2.000096 0.000096 0.0000% 5.0000% 10.0000% 15.0000% 20.0000% 25.0000% 30.0000% 3S0000% 4S0000% 400000% Standard Deviation of Returns Efficient Frontier -+-Capital Market Line