

Answered step by step
Verified Expert Solution
Question
1 Approved Answer
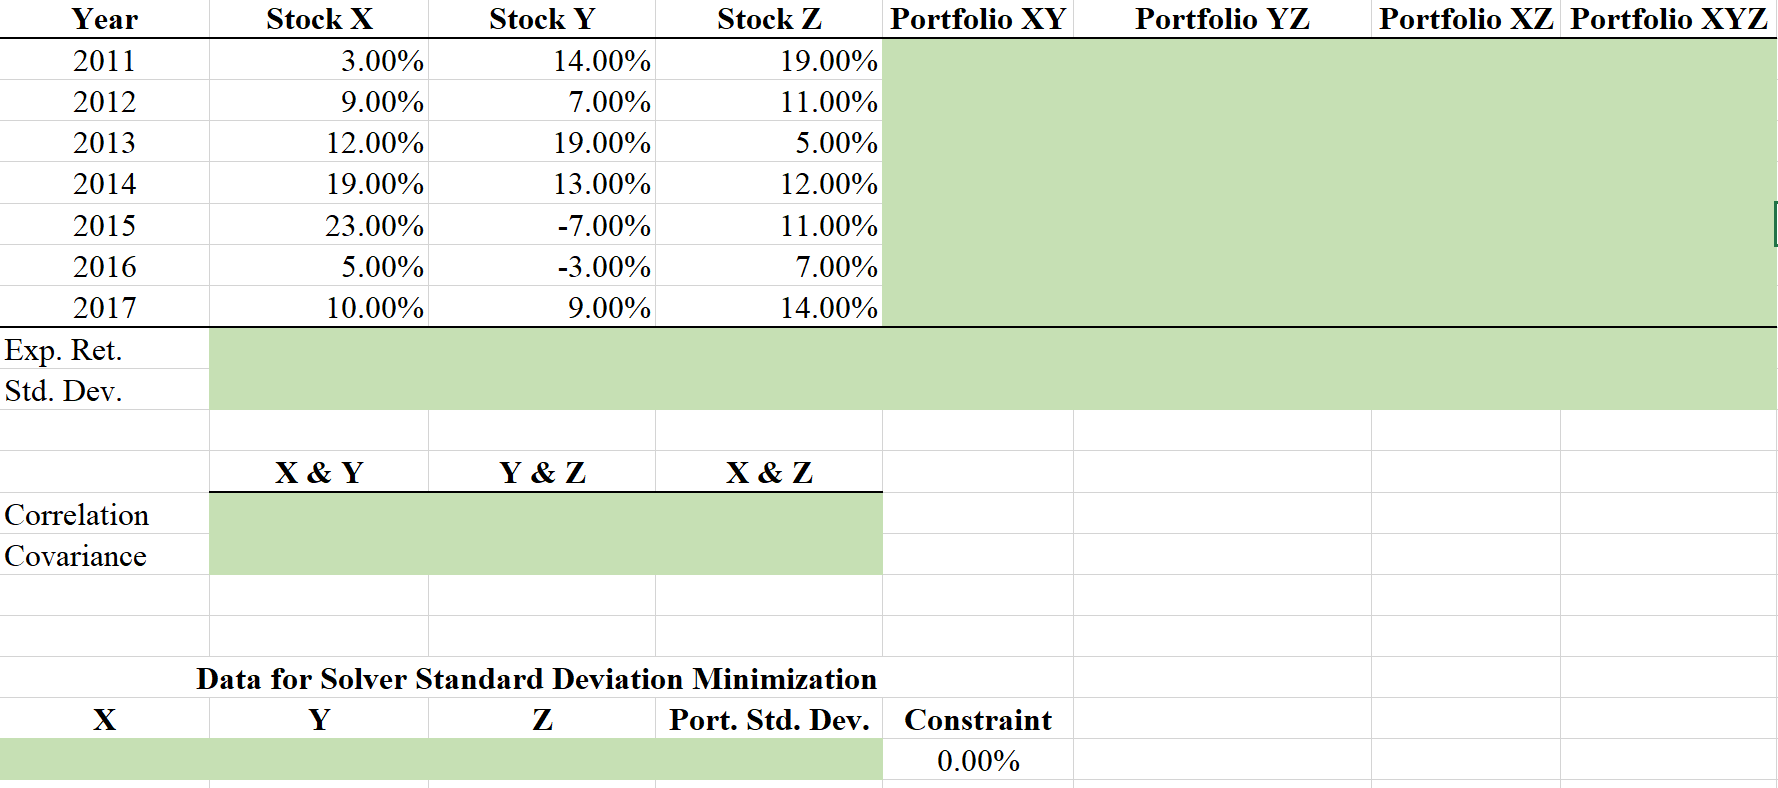
Excel Determine the average return and the standard deviation of returns for each stock. Use sample statistics (e.g., STDEV.S function). Determine the correlation coefficient and
Excel
- Determine the average return and the standard deviation of returns for each stock. Use sample statistics (e.g., STDEV.S function).
- Determine the correlation coefficient and the covariance between each pair of stocks. Use sample statistics (e.g., COVARIANCE.S function).
- Determine the average return and the standard deviation of returns of equally weighted portfolios consisting of two stocks (XY, YZ, and XZ) and three (XYZ) stocks.
- Use the Solver to determine the minimum standard deviation that could be obtained by combining all three stocks into a single portfolio. Create an answer report for your solver solution.
Step by Step Solution
There are 3 Steps involved in it
Step: 1

Get Instant Access to Expert-Tailored Solutions
See step-by-step solutions with expert insights and AI powered tools for academic success
Step: 2

Step: 3
Ace Your Homework with AI
Get the answers you need in no time with our AI-driven, step-by-step assistance
Get Started
Finance Led Capitalism Shadow Banking Re Regulation And The Future Of Global Markets
Authors: Robert Guttmann
1st Edition
1137398566, 978-1137398567