Question
Excel Exercise #5 Budgeting for Debt Service Using Constant Principal Prepared by Lewis F. McLain, Jr.1,Consultant, Trainer, Writer, Analyst, Investor (Contact: lfm@citybase.net) Background Debt service
Excel Exercise #5
Budgeting for Debt Service Using Constant Principal
Prepared by
Lewis F. McLain, Jr.1,Consultant, Trainer, Writer, Analyst, Investor (Contact: lfm@citybase.net)
Background
Debt service is usually a significant part of local government budgets. As much as one-third of the property tax rate can go to pay the annual principal and interest (also called I&S or interest & sinking fund) that comes due. That debt service, usually paid semi-annually, is included in the operating budget as part of a local governments annual appropriation. Funds from the tax for the debt service are deposited into the Debt Service Find, discussed on p. 238 in A Budgeting Guide for Local Government, 4th edition.
The data in Excel Exercise #4 illustrate a decreasing debt service repayment schedule (column H) with level principal payments. Alternative repayment schedules (not illustrated in this exercise) include level annual debt service repayments with decreasing principal payments and, less frequently, annual interest only payments with a balloon payment for the principal in the last year at maturity for the bond issue.
Understanding debt service
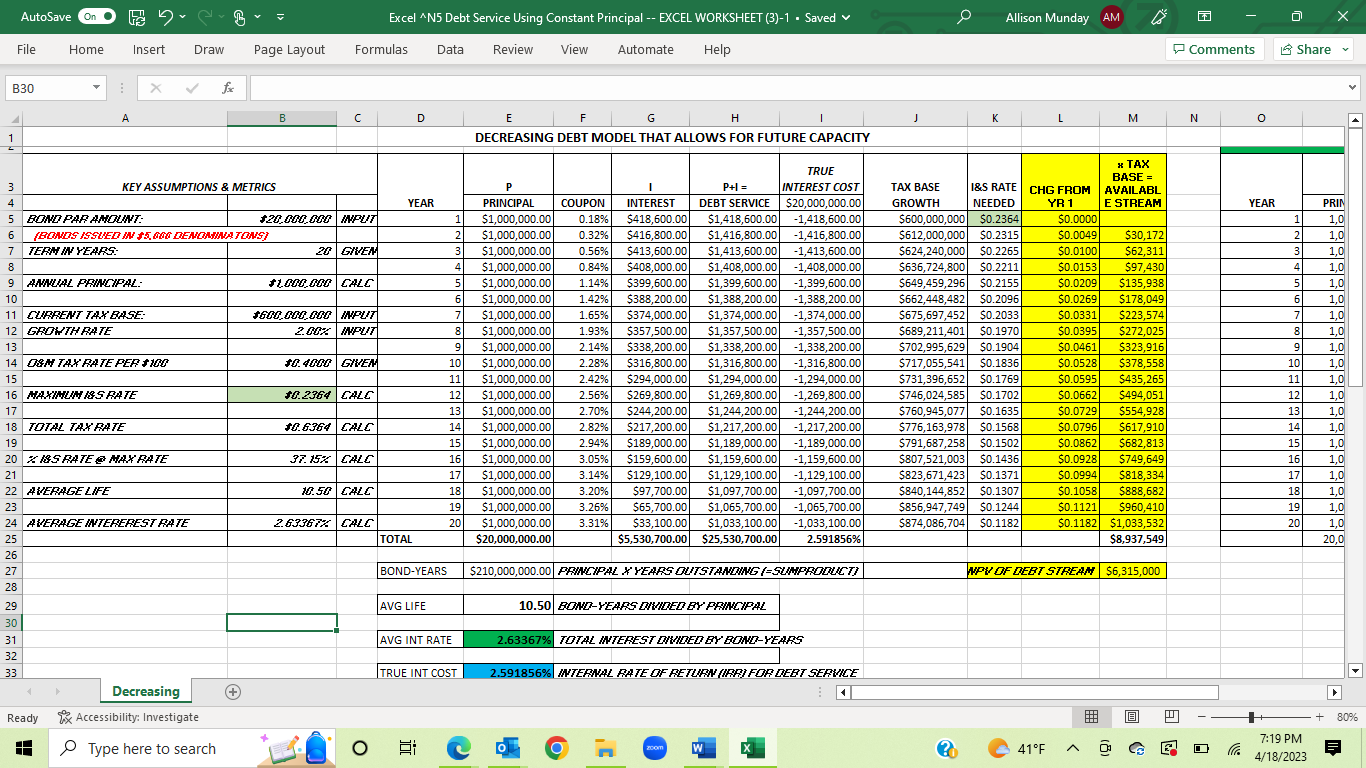
The accompanying Excel Exercise #4 worksheet identifies the variables used when computing the annual debt service for budget purposes including the debt capacity available to service that debt. Columns A to C provide the key assumptions and metrics for this bond issue:
par amount of the bonds of $20 million (B5),
term (or life) of 20 years for the serial bond issue (B7),
initial size of the tax base from which the bonds will be repaid of $600,000 (B11),
annual growth in the tax base of 2% (B12),
operations & maintenance (O&M) property tax rate (B14) of $0.40 /$100 of assessed value, which is assumed to be constant for all 20 years, and
total property tax rate (O&M + I&S) (B18). These assumptions and metrics can be altered as circumstances change with corresponding adjustments to the annual repayment of principal and interest.
The annual principal in cell B9 is computed as B5/B7. Municipal bonds are typically sold to investors in $5,000 denominations. However, a warning on the Excel worksheet alerts the analyst if this is not the case. For example, if $20,000,100 is entered, the calculation still works, but a warning appears alerting the analyst that not all bonds are in $5,000 denominations.
The output table from D3:L31 shows the distribution of repayment of the principal by year. Municipal bonds are typically issued with maturities staggered in a series over the life of the issue, giving rise to the term serial bond issue. In this example, 400 bonds each worth $5,000 are issued for each year, or a total of $1,000,000 annually for the 20 years of the bond issue. Thus, this debt schedule includes $1 million in bonds maturing in the first year, another $1 million in bonds maturing in the second year, and eventually $1 million bonds maturing in the twentieth year.
The coupon interest rate (column F) is the annual interest rate that bonds in each series (or maturity) pay to investors. In this example, these rates are the same as those on the yield curve (shown on the Excel worksheet), which reports the rates that similar bonds in the marketplace are earning by years to maturity. Because bonds with longer maturities carry more risk, investors expect a higher yield, which explains the upward sloping yield curve. Bonds with longer maturities have higher coupon interest rates (column F). The Excel graph shows a normal yield curve where the costs to the municipal issuer are matched to the higher risk that the investor incurs.
The annual interest cost is computed in Rows G5:G24. Note that the SUMPRODUCT function in Excel is used. The total interest paid by this issuer for the $20 million in principal is $5,530,700 (G25). In order to keep the computations manageable, this exercise shows interest being paid annually. In fact, state and local governments most always pay the interest semi-annually and the principal annually.
Average interest rate
The average interest rate (B24) provides the budget analyst with a measure that can be used to compare the cost of this bond issue with other issues. Several steps are involved in computing this average rate, also called the net interest cost (NIC). First, a factor called bond years is computed that takes into account the serial maturity of the issue. If the bonds were all paid off in the first year, there would be 20 million bond years ($20 million x 1). If the bonds were not repaid until the last year, there would be 400 million bond years ($20 million x 20 years). For the current example of $20 million in bonds maturing annually in $1 million increments over 20 years, the number of bond years is $210 million (think SUMPRODUCT).
The second step involves computing the average life for the bonds by dividing the bond years ($210 million) by the par value ($20 million). The result is 10.5 years of average life (B22). Analysts would thus describe this sale as a $20 million bond issue with an average life of 10.5 years. Bond rating agencies, such as Moodys and Standard & Poors, consider bonds with a longer average life as having greater risk, and interest rates will reflect that higher risk. Of note, all level principal repayment schedules have an average life of the full term divided by 2 plus 0.5.
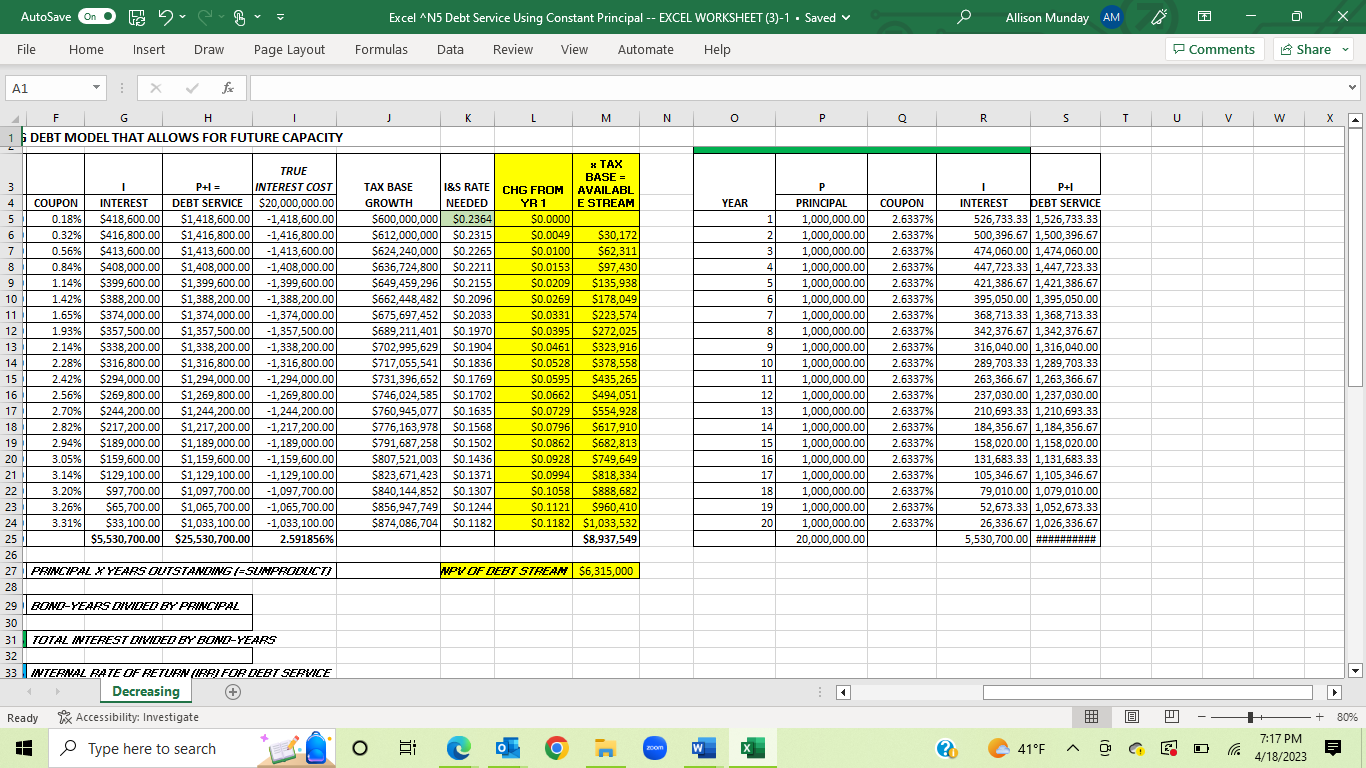
The final step involves computing the average interest rate for the serial bonds. This involves dividing the total interest cost ($5,530,700) by the bond years ($210 million) to get 2.63367% (B24 and E31). This is the average interest rate for this serial bond issue, which is essentially the weighted average of the coupon rates. The repayment schedule in the Excel worksheet to the right of the basic table (O2:S25) illustrates that the average interest rate results in a uniform repayment of principal across the 20 year life of this issue.
One more useful observation is that if these bonds pay for capital projects that last for at least 20 years and if inflation over this time period averages 2.63367, then the debt service in either Columns H or S is $20,000,000. Therefore, the real interest cost of issuing these bonds is $5,530,700, making the effective cost of the debt equal to zero. For this reason, inflation favors debtors by allowing them to borrow with cheaper dollars and repay that debt with inflated dollars.
Time value of money
Another, more accurate, comparative measure of the cost of a bond issue is its true interest cost or TIC (I33). This measure takes into account an important concept in public finance -- the time value of money. We speak of the value of time and time is money. The fact that time has value, separate from inflation, requires discounting the debt service payments to their present value. That is, the TIC takes into account the monetary value of time and represents the true cost of the debt to this issuer. As such TIC is a more accurate measure of the cost of a bond issue than the average interest cost.
Assessing the capacity for more debt
The data in Excel Exercise #4 provide a basis for the analyst to determine the local governments capacity to issue more debt. The debt service in year 1 totals $1,418,600 (H5). Given the initial property tax base of $600 million for that year and the assumed 2% annual growth in that base, the required I&S tax rate to fund the debt (column K) is computed by dividing the debt service (column H) by the available tax base (column J). For year 1, the required I&S rate is $0.2364 per $100 value. Given the constant level of principal repayment, this is the maximum I&S rate required for this bond issue. What is a reasonable debt burden for this local government and its taxpayers?
To answer that question, the budget analyst first determines the portion of the total tax rate that the I&S rate represents (B18). In year 1, the I&S rate is 37.15% of the total tax rate (K5/B14). For a local government that is experiencing moderate rates of growth in population, a rule-of-thumb is 70/30 ratio of I&S to O&M; for more rapidly growing governments a ratio of
60/40 may be justified. Rarely would the ratio exceed this limit, however.
How much more debt can this local government issue without exceeding the 40% limit on the I&S portion of the property tax rate? This local government could have issued as much as $22,500,000 with an I&S rate of 39.94% and stayed within the limit.
The graph below depicts the constant level of principal but the declining level of interest payments. That leaves room for additional debt that can be issued and can be financed at the same tax rate depicted in the green bars. In fact, more debt can be issued if the tax base remains does not grow the 2% annual rate that is assumed. And even more debt can be issued if the tax base grows.
Given the time value of money, issuing $1 million in new debt in year 10 is not the same as $1 million being issued today. Cell M27 reports the net present value of the additional debt capacity this local government could issue and not increase its I&S tax rate above the maximum of $0.2364.
The worksheet also enables the budget analyst to assess the sensitivity of the assumptions (columns A-C) made in this scenario. For example, change the annual growth rate in the tax base to 1% (or any amount) to see the impact on the debt schedule and the debt capacity. Other assumptions can be modified to gage thesensitivity of the debt schedule and capacity to these estimates.
Discussion questions
1. As the budget analyst, how much should this local government budget for debt service in the first year? How much in the 10th year? In the 20th year?
2. Assume that growth in the tax base increases to an average of 2.5% annually. How much should the local government budget for debt service in the first year? In the 10th year? In the 20th year? How much more debt can be issued in year 10? In year 20? For all 20 years?
3. Returning the annual tax base growth to 2%, assume that the coupon interest rates increase by 1% (.01). How much does the interest cost increase? The average interest rate? The true interest cost?
4. The Council has asked how much in total interest would be due if the par amount increased to $22 million. How does the ratio of I&S to the total tax rate change if this new amount of debt is sold? Is it within the recommended cap? How much in total new debt is now possible with this new par amount? How do you explain to the council the meaning of the net present value of this amount?


Step by Step Solution
There are 3 Steps involved in it
Step: 1

Get Instant Access to Expert-Tailored Solutions
See step-by-step solutions with expert insights and AI powered tools for academic success
Step: 2

Step: 3

Ace Your Homework with AI
Get the answers you need in no time with our AI-driven, step-by-step assistance
Get Started


