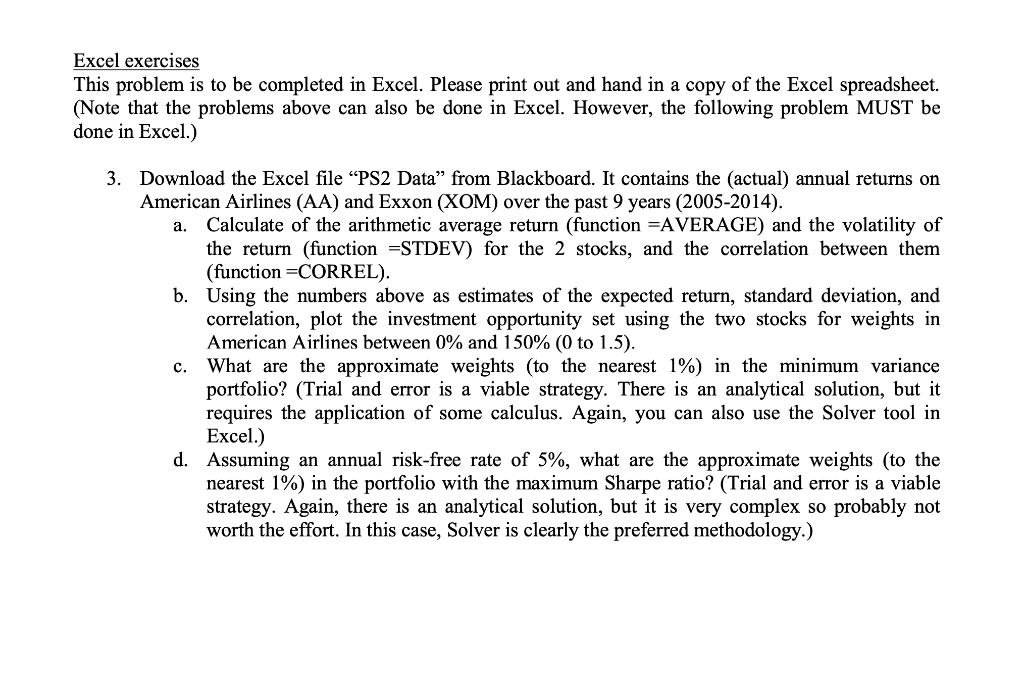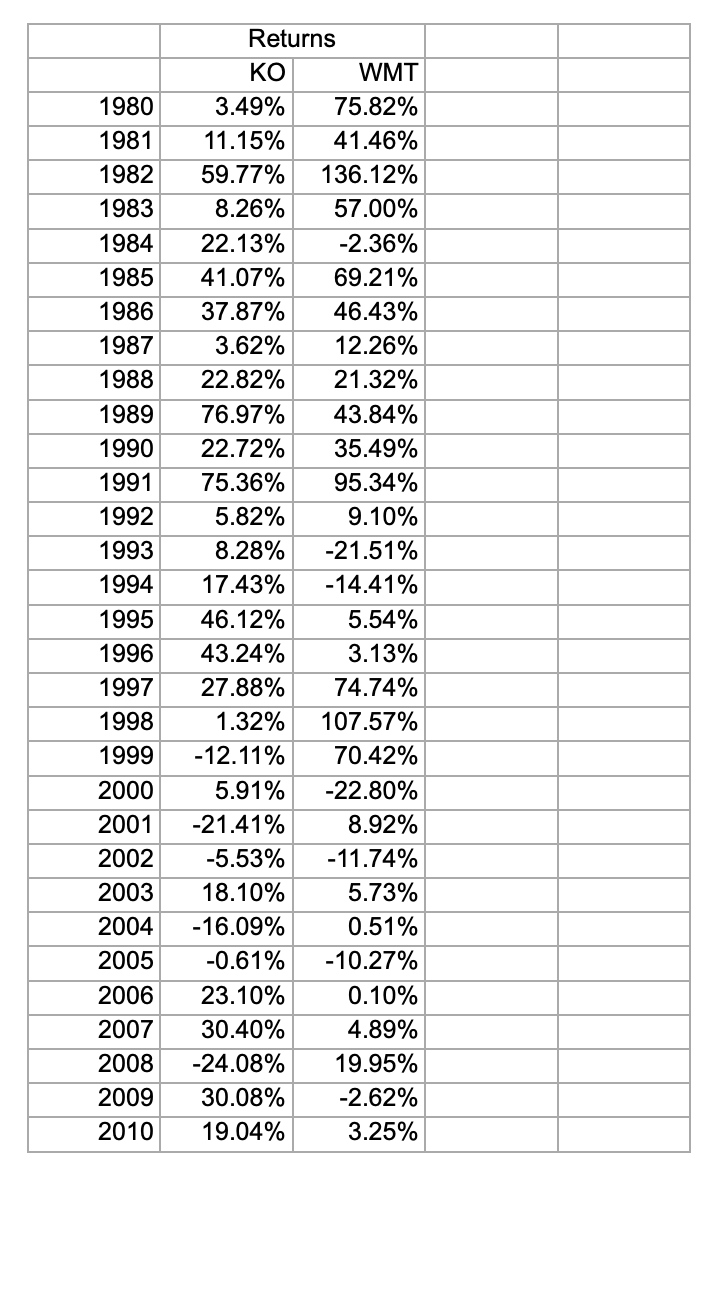

Excel exercises This problem is to be completed in Excel. Please print out and hand in a copy of the Excel spreadsheet. (Note that the problems above can also be done in Excel. However, the following problem MUST be done in Excel.) 3. Download the Excel file "PS2 Data" from Blackboard. It contains the (actual) annual returns on American Airlines (AA) and Exxon (XOM) over the past 9 years (2005-2014). a. Calculate of the arithmetic average return (function=AVERAGE) and the volatility of the return (function =STDEV) for the 2 stocks, and the correlation between them (function =CORREL). b. Using the numbers above as estimates of the expected return, standard deviation, and correlation, plot the investment opportunity set using the two stocks for weights in American Airlines between 0% and 150% ( 0 to 1.5). c. What are the approximate weights (to the nearest 1% ) in the minimum variance portfolio? (Trial and error is a viable strategy. There is an analytical solution, but it requires the application of some calculus. Again, you can also use the Solver tool in Excel.) d. Assuming an annual risk-free rate of 5%, what are the approximate weights (to the nearest 1% ) in the portfolio with the maximum Sharpe ratio? (Trial and error is a viable strategy. Again, there is an analytical solution, but it is very complex so probably not worth the effort. In this case, Solver is clearly the preferred methodology.) \begin{tabular}{|r|r|r|l|l|} \hline & \multicolumn{2}{|c|}{ Returns } & & \\ \hline & KO & WMT & & \\ \hline 1980 & 3.49% & 75.82% & & \\ \hline 1981 & 11.15% & 41.46% & & \\ \hline 1982 & 59.77% & 136.12% & & \\ \hline 1983 & 8.26% & 57.00% & & \\ \hline 1984 & 22.13% & 2.36% & & \\ \hline 1985 & 41.07% & 69.21% & & \\ \hline 1986 & 37.87% & 46.43% & & \\ \hline 1987 & 3.62% & 12.26% & & \\ \hline 1988 & 22.82% & 21.32% & & \\ \hline 1989 & 76.97% & 43.84% & & \\ \hline 1990 & 22.72% & 35.49% & & \\ \hline 1991 & 75.36% & 95.34% & & \\ \hline 1992 & 5.82% & 9.10% & & \\ \hline 1993 & 8.28% & 21.51% & & \\ \hline 1994 & 17.43% & 14.41% & & \\ \hline 1995 & 46.12% & 5.54% & & \\ \hline 1996 & 43.24% & 3.13% & & \\ \hline 1997 & 27.88% & 74.74% & & \\ \hline 1998 & 1.32% & 107.57% & & \\ \hline 1999 & 12.11% & 70.42% & & \\ \hline 2000 & 5.91% & 22.80% & & \\ \hline 2001 & 21.41% & 8.92% & & \\ \hline 2002 & 5.53% & 11.74% & & \\ \hline 2003 & 18.10% & 5.73% & & \\ \hline 2004 & 16.09% & 0.51% & & \\ \hline 2005 & 0.61% & 10.27% & & \\ \hline 2006 & 23.10% & 0.10% & & \\ \hline 2007 & 30.40% & 4.89% & & \\ \hline 2008 & 24.08% & 19.95% & & \\ \hline 2009 & 30.08% & 2.62% & & \\ \hline & 19.04% & 3.25% & & \\ \hline & & & \\ \hline & & \\ \hline \end{tabular}


