Excel File Edit View Insert Format Tools Data Window Help AutoSave O A A P J . C ... x: Spring 22 Final Exam-Wellbeing D
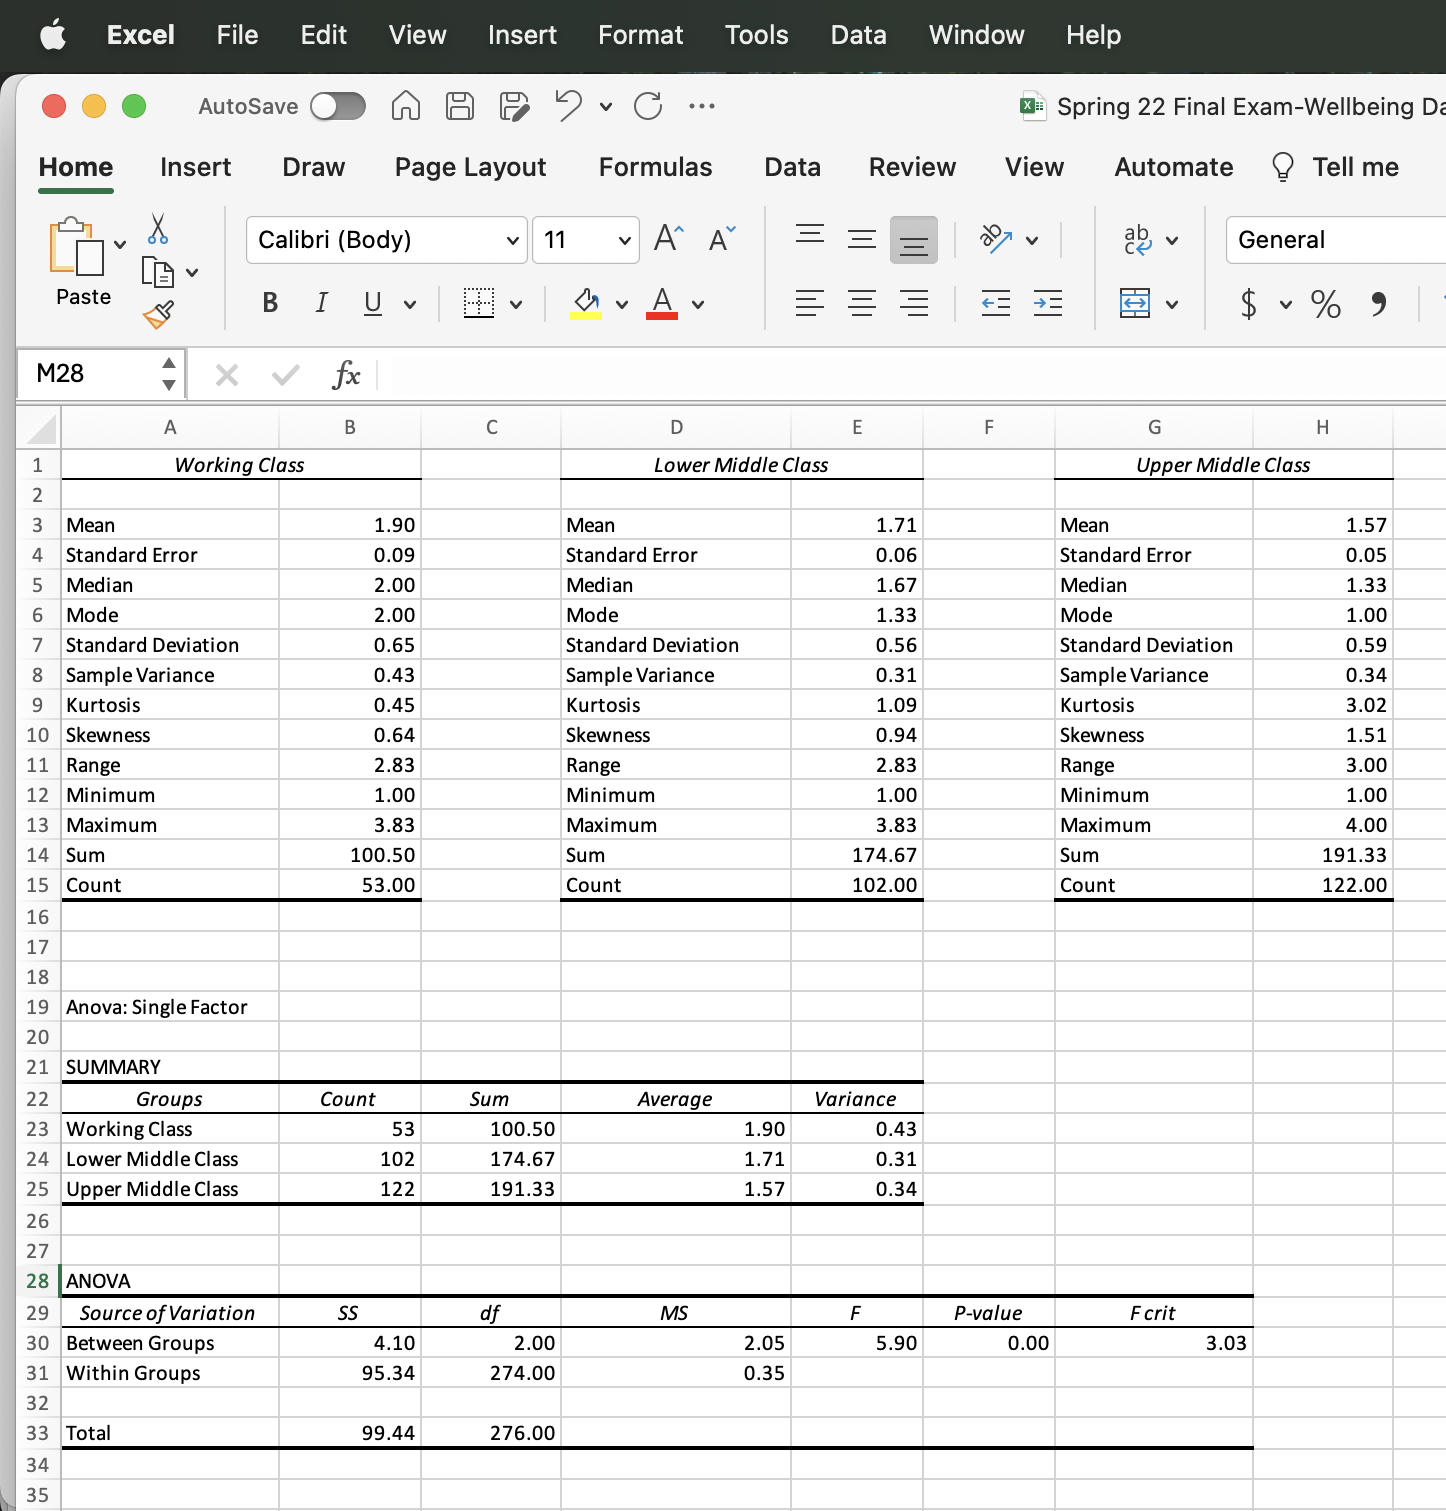
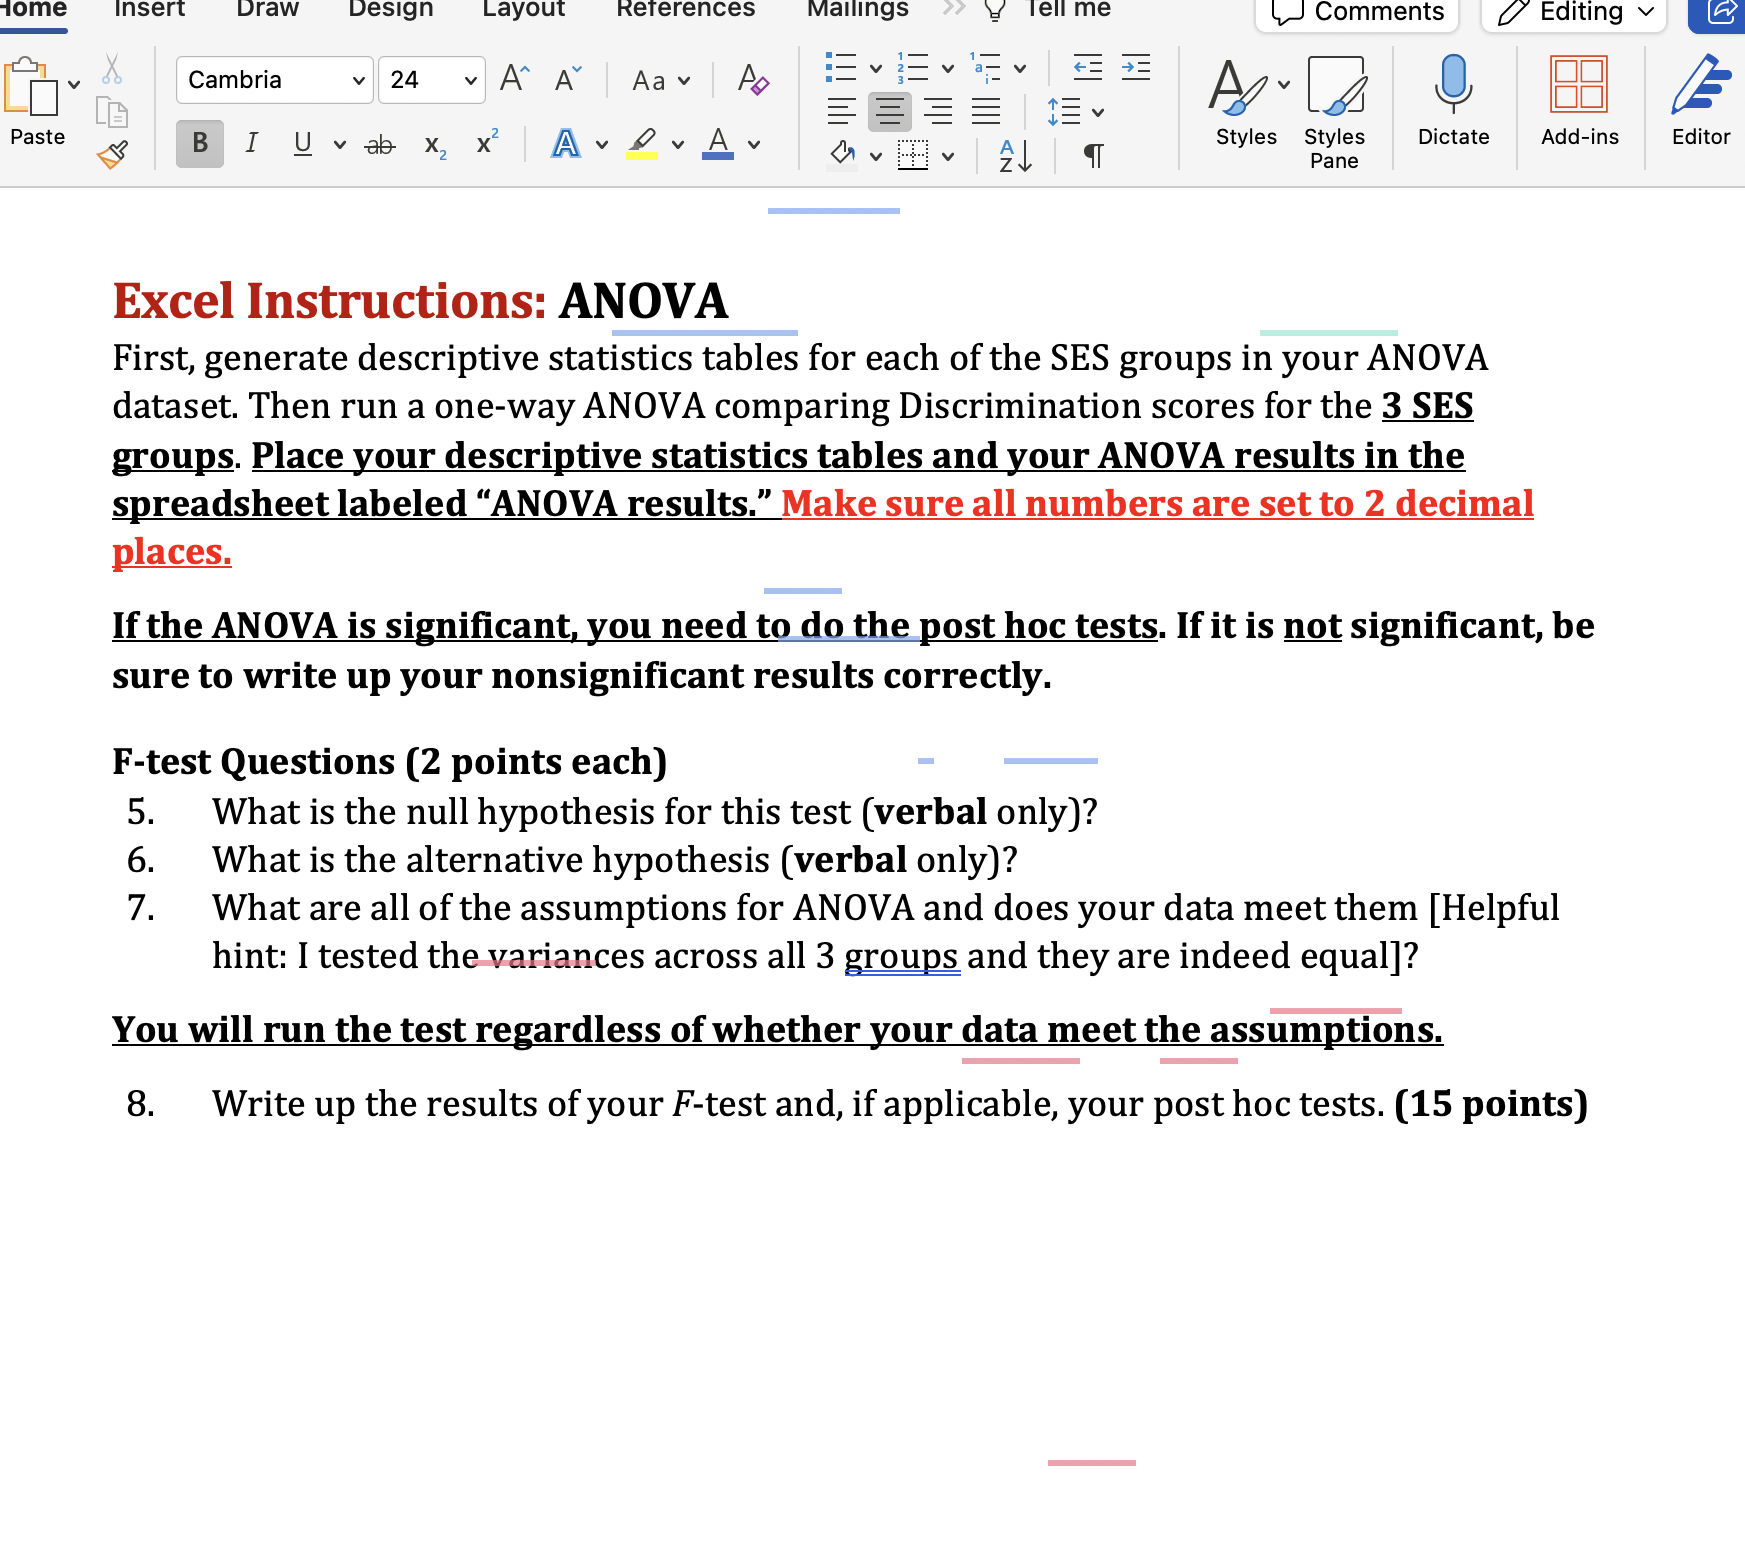
Excel File Edit View Insert Format Tools Data Window Help AutoSave O A A P J . C ... x: Spring 22 Final Exam-Wellbeing D Home Insert Draw Page Layout Formulas Data Review View Automate Tell me Calibri (Body) 11 A A ag General Paste BI U V MVA F V $ ~ % " M28 X V fx A B C D E F G H Working Class Lower Middle Class Upper Middle Class WNH Meat 1.90 Mean 1.71 Mear 1.57 4 Standard Error 0.09 Standard Error 0.06 Standard Error 0.05 5 Median 2.00 Median 1.67 Median 1.33 6 Mode 2.00 Mode 1.33 Mode 1.00 Standard Deviation 0.65 Standard Deviation 0.56 Standard Deviation 0.59 8 Sample Variance 0.43 Sample Variance 0.31 Sample Variance 0.34 9 Kurtosis 0.45 Kurtosis 1.09 Kurtosis 3.02 10 Skewness 0.64 Skewness 0.94 Skewness 1.51 11 Range 2.83 Range 2.83 Range 3.00 12 Minimum 1.00 Minimum 1.00 Minimum 1.00 13 Maximum 3.83 Maximum 3.83 Maximum 4.00 14 Sum 100.50 Sum 174.67 Sum 191.33 15 Count 53.00 Count 102.00 Count 122.00 16 17 18 19 Anova: Single Factor 20 21 SUMMARY 22 Groups Count Sum Average Variance 23 Working Class 53 100.50 1.90 0.43 24 Lower Middle Class 102 174.67 1.71 0.31 25 Upper Middle Class 122 191.33 1.57 0.34 26 27 28 ANOVA 29 Source of Variation df MS F P-value F crit 30 Between Groups 4.10 2.00 2.05 5.90 0.00 3.03 31 Within Groups 95.34 274.00 0.35 32 33 Total 99.44 276.00 34 35dome Insert Draw Design Layout References Mailings Tell me Comments Editing Cambria 24 A" A Aav Fviva=v Paste B I Uvab X X A DAY Styles Styles Dictate Add-ins Editor 21 T Pane Excel Instructions: ANOVA First, generate descriptive statistics tables for each of the SES groups in your ANOVA dataset. Then run a one-way ANOVA comparing Discrimination scores for the 3 SES groups. Place your descriptive statistics tables and your ANOVA results in the spreadsheet labeled "ANOVA results." Make sure all numbers are set to 2 decimal places. If the ANOVA is significant, you need to do the post hoc tests. If it is not significant, be sure to write up your nonsignificant results correctly. F-test Questions (2 points each) 5. What is the null hypothesis for this test (verbal only)? 6. What is the alternative hypothesis (verbal only)? 7. What are all of the assumptions for ANOVA and does your data meet them [ Helpful hint: I tested the variances across all 3 groups and they are indeed equal]? You will run the test regardless of whether your data meet the assumptions. 8. Write up the results of your F-test and, if applicable, your post hoc tests. (15 points)
Step by Step Solution
There are 3 Steps involved in it
Step: 1
Get Instant Access to Expert-Tailored Solutions
See step-by-step solutions with expert insights and AI powered tools for academic success
Step: 2
Step: 3
Ace Your Homework with AI
Get the answers you need in no time with our AI-driven, step-by-step assistance