Answered step by step
Verified Expert Solution
Question
1 Approved Answer
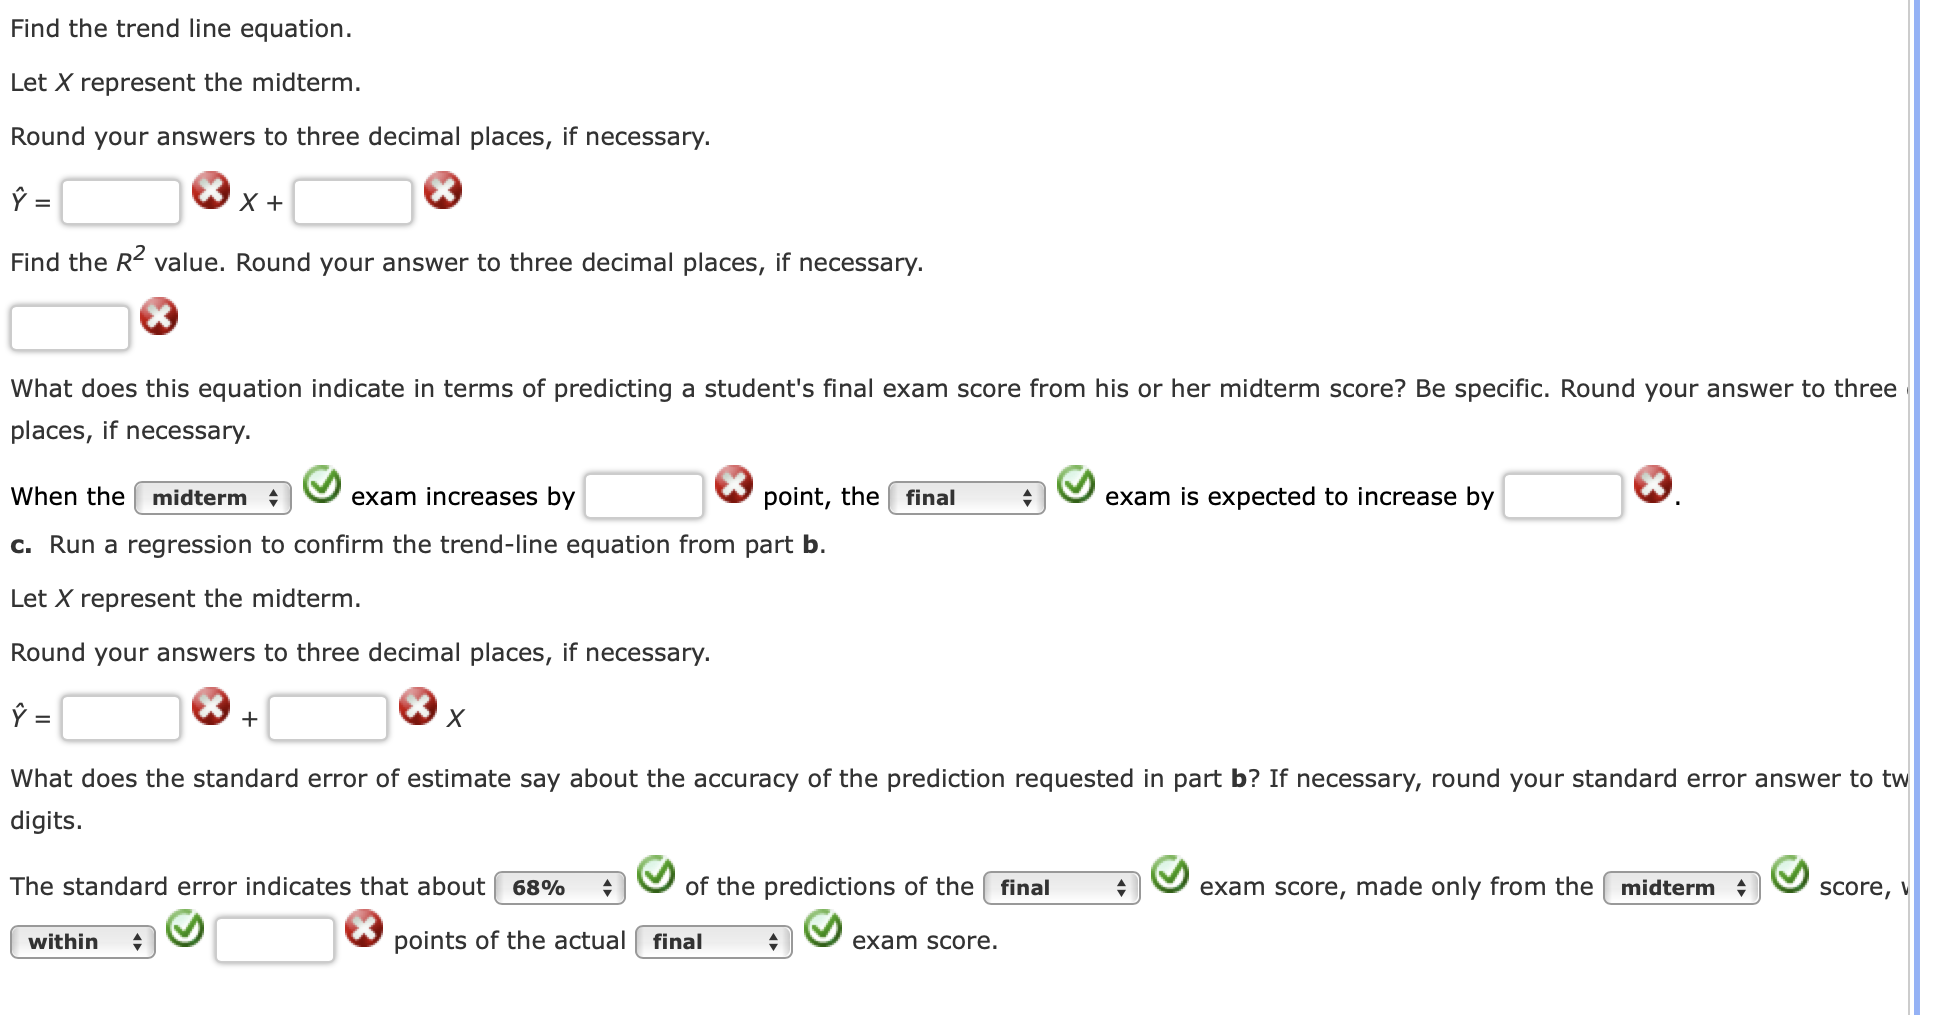
Excel Link:https://docs.google.com/spreadsheets/d/1Lq9lFZ1SB1sjhxay07GH5H5e2WSHW_5X/edit?usp=sharing&ouid=111846680843393654433&rtpof=true&sd=true The file P10_02.xlsx contains midterm and final exam scores for 96 students in a corporate finance course. Each row contains the two exam
Excel Link:https://docs.google.com/spreadsheets/d/1Lq9lFZ1SB1sjhxay07GH5H5e2WSHW_5X/edit?usp=sharing&ouid=111846680843393654433&rtpof=true&sd=trueThe file P10_02.xlsx contains midterm and final exam scores for 96 students in a corporate finance course. Each row contains the two exam scores for a given student, so you might expect them to be positively correlated.

Step by Step Solution
There are 3 Steps involved in it
Step: 1

Get Instant Access to Expert-Tailored Solutions
See step-by-step solutions with expert insights and AI powered tools for academic success
Step: 2

Step: 3

Ace Your Homework with AI
Get the answers you need in no time with our AI-driven, step-by-step assistance
Get Started


