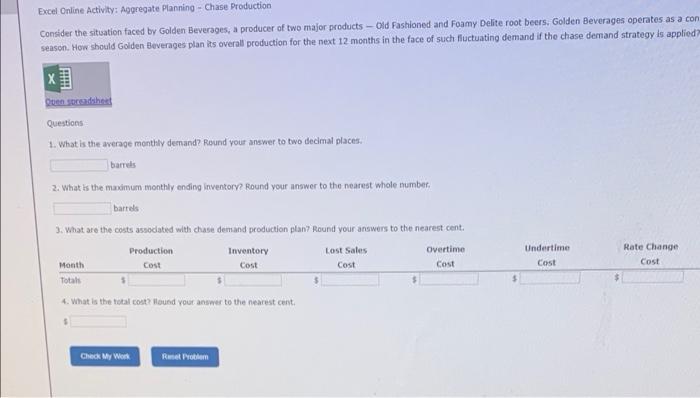
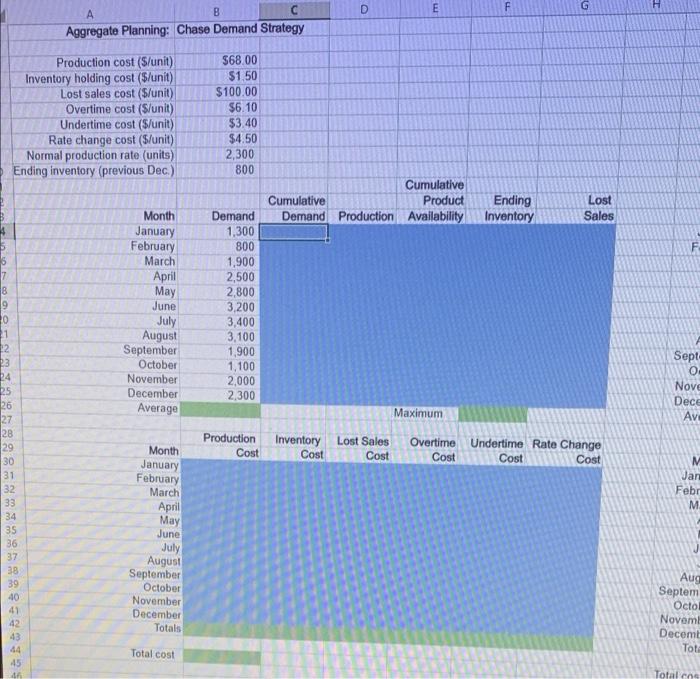
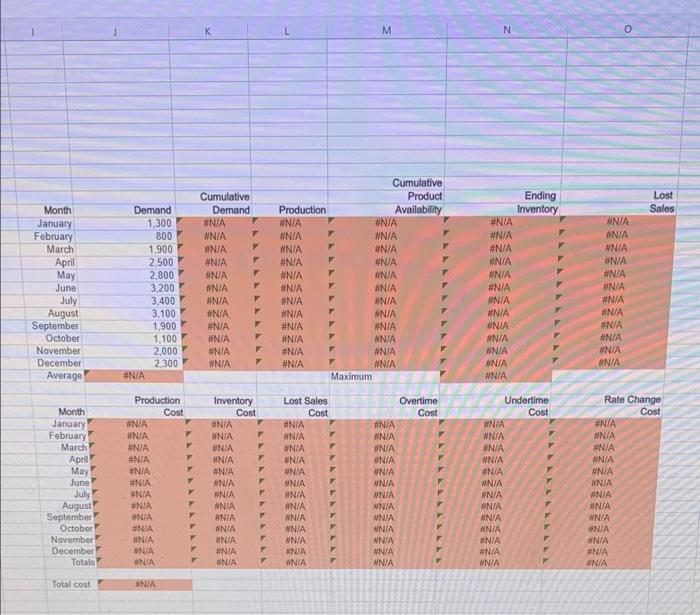
Excel Online Activity: Aggregate Planning - Chase Production Consider the situation faced by Golden Beverages, a producer of two major products - Old Fashioned and Foamy Delite root beers. Golden Beverages operates as a con season. How should Golden Beverages plan its overall production for the next 12 months in the face of such fluctuating demand if the chase demand strategy is applied X Den sordshed Questions 1. What is the average monthly demand? Round your answer to two decimal places, barrels 2. What is the mundum monthly ending inventory Round your answer to the nearest whole number, barrels 3. What are the costs assodated with chase demand production plan Round your answers to the nearest cent, Production Inventory Lost Sales Overtime Month Cost Cost Cost Cost Total Undertime Cost Rate Change Cost 4. What is the total cost? Wound your answer to the nearest cent. Check My Wien Ret Problem D E F H G A B Aggregate Planning: Chase Demand Strategy Production cost (S/unit) Inventory holding cost ($/unit) Lost sales cost (5/unit) Overtime cost (S/unit) Undertime cost (S/unit) Rate change cost (S/unit) Normal production rate (units) Ending inventory (previous Dec.) $68.00 $1.50 $100.00 $6.10 $3,40 $4.50 2,300 800 Cumulative Cumulative Product Demand Production Availability Ending Inventory Lost Sales Month January February March April May June Demand 1.300 800 1,900 2,500 2,800 3,200 3,400 3,100 1,900 1,100 2.000 2.300 July August September October November December Average Sept 0 Nove Dece AV Production Cost Maximum Inventory Lost Sales Overtime Cost Cost Cost Undertime Rate Change Cost Cost 7 8 9 20 21 2 P3 24 25 26 27 28 29 30 31 32 33 34 35 36 37 38 39 40 41 42 43 44 Month January February March April May June M Jan Febr M July GODE SER August September October November December Totals Aug Septem Octo! Novem Decemt Tot Total cost Totalcos M N Ending Inventory Lost Sales Month January February March April May June July August September October November December Average Demand 1.300 800 1,900 2.500 2,800 3.200 3.400 3,100 1,900 1,100 2.000 2.300 #NIA Cumulative Demand ONIA #NIA #NIA F #N/A ANIA #N/A #N/A #N/A #N/A WNIA #N/A #N/A Cumulative Product Production Availability WNIA #N/A #N/A #N/A WNIA F #N/A #N/A #NIA #N/A #N/A #N/A WNIA F #N/A N/A #N/A #N/A #N/A #NIA #N/A #N/A #NIA WNIA WNIA #NIA Maximum #NIA #N/A #N/A #N/A #N/A #N/A #NIA #N/A #NIA #N/A WNIA #N/A #N/A #N/A #N/A NIA #N/A #N/A #N/A #N/A #N/A N/A #N/A #N/A #N/A Month January February March April May June July August September October November December Totais Production Cost WNIA WNIA #N/A ENIA #NIA #NIA ANIA #NIA ENIA #NIA F ENIA UNIA NA Inventory Cost WNIA #NIA UNIA IN/A #N/A ANIA ANIA #NIA ANIA #N/A UNIA WNIA #NIA Lost Sales Cost #NIA #N/A #N/A F #NIA #NIA F WNIA ONIA #N/A ANIA F WN/A WN/A UNIA F #NIA MIL Overtime Cost #N/A #N/A #N/A UNIA WNIA #N/A WNIA UNIA WNIA WNIA #N/A ANA #N/A Undertime Cost ANIA #N/A AN/A WNIA #N/A #N/A #N/A WNIA F WNIA WN/A #N/A F #NIA INIA Rate Change Cost WNIA #N/A #N/A ANIA #N/A INIA #NIA ON/A #N/A WNIA #N/A #N/A WNA F Total cost WNIA