Answered step by step
Verified Expert Solution
Link Copied!

Question

1 Approved Answer

Excel output from a test of hypothesis is shown in the following figure . Figure 1 : t - Test : Two - Sample Assuming
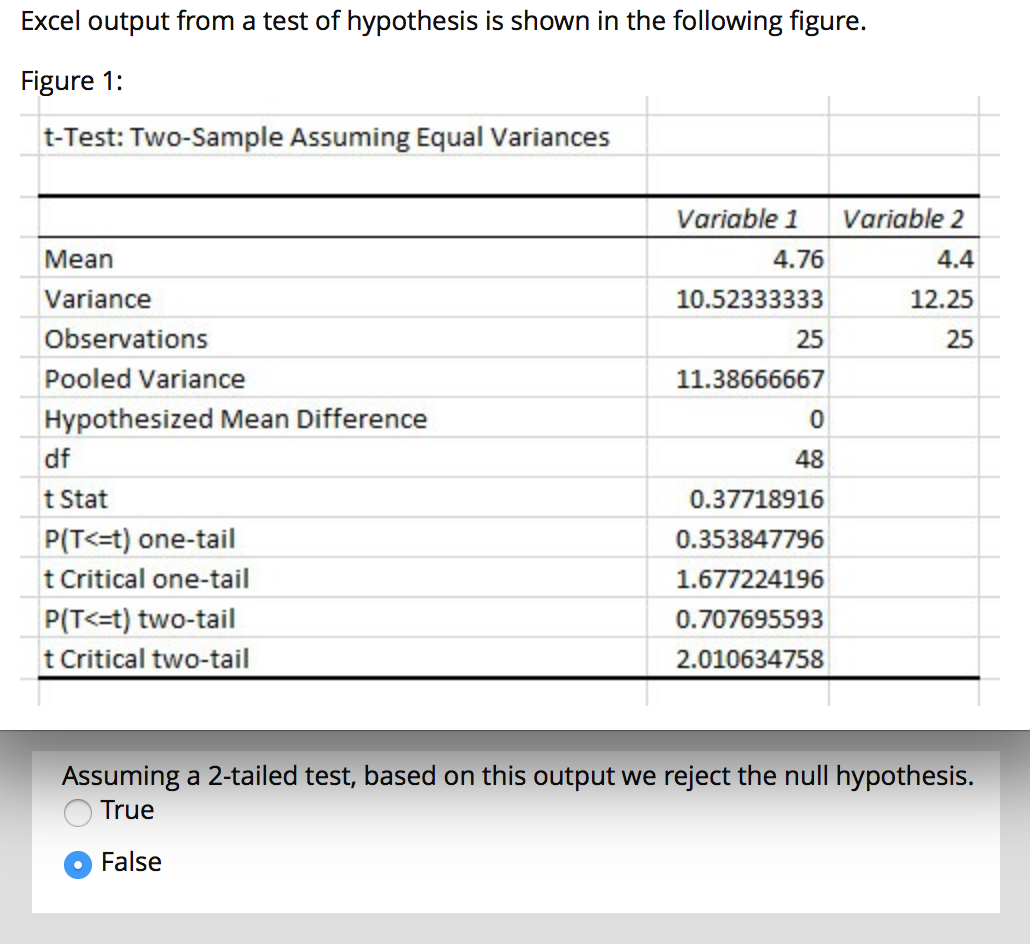
image text in transcribed
Excel output from a test of hypothesis is shown in the following figure . Figure 1 : t - Test : Two - Sample Assuming Equal Variances Variable 1| Variable 2\\ Mean 4. 76 4. 4 Variance 10. 523 3 3 3 33 12. 25 Observations 25 25 Pooled Variance 11. 38656567 Hypothesized Mean Difference Of 48 + Stat 0. 37 718916 P ( T

Step by Step Solution

There are 3 Steps involved in it

Step: 1

blur-text-image

Get Instant Access to Expert-Tailored Solutions

See step-by-step solutions with expert insights and AI powered tools for academic success

Step: 2

blur-text-image

Step: 3

blur-text-image

Ace Your Homework with AI

Get the answers you need in no time with our AI-driven, step-by-step assistance

Get Started

Recommended Textbook for

Algebra 2

Authors: HOLT MCDOUGAL

Common Core Edition

9780547647074

More Books

Students also viewed these Mathematics questions