Answered step by step
Verified Expert Solution
Question
1 Approved Answer
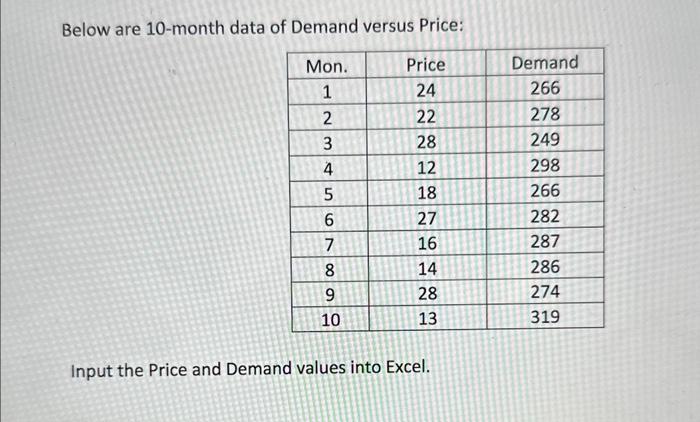
excel please Below are 10 month data of Demand versus Price: Input the Price and Demand values into Excel. a) Produce a scatter plot of
excel please 


Below are 10 month data of Demand versus Price: Input the Price and Demand values into Excel. a) Produce a scatter plot of Demand versus Price. The vertical axis (Demand) should start at 200 and the horizontal axis should start at 10 . Add a linear fit to the scatter plot and show the equation on the scatter plot. b) Based on the fitted model, compute MAPE. Must show all the computational steps leading to your final answer. Keep 3 decimal places. 1. Use the fitted model to compute the predicted demand for each month. 2. For each month, compute the absolute error between the actual demand and the predicted demand. 3. For each month, compute the APE. Refer to the lecture slide. 4. Calculate the average value of all APE values.) 


Step by Step Solution
There are 3 Steps involved in it
Step: 1

Get Instant Access to Expert-Tailored Solutions
See step-by-step solutions with expert insights and AI powered tools for academic success
Step: 2

Step: 3

Ace Your Homework with AI
Get the answers you need in no time with our AI-driven, step-by-step assistance
Get Started


