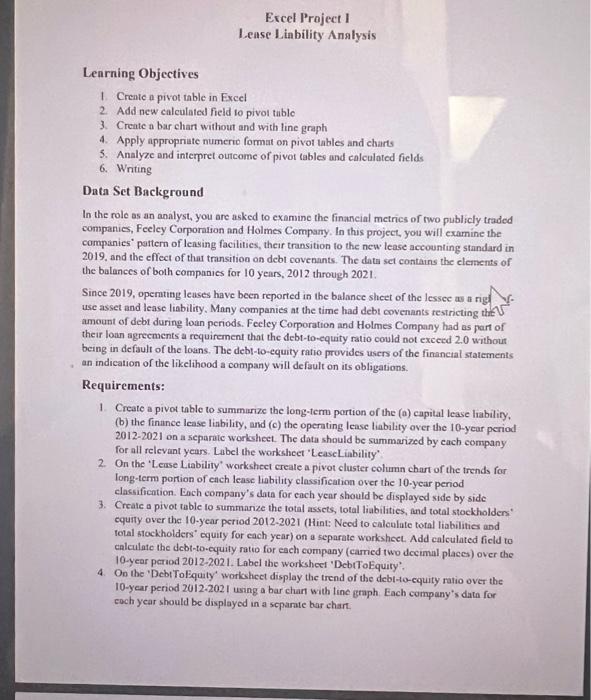
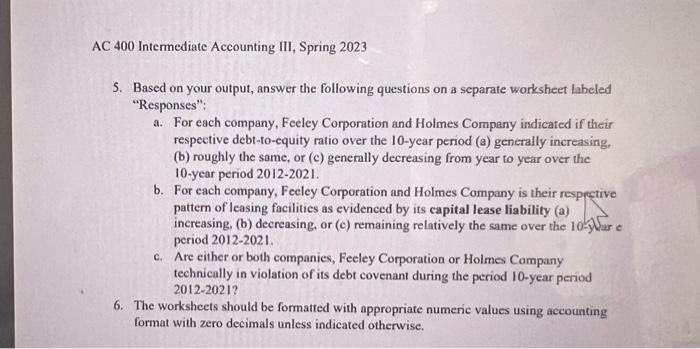
Excel Project 1 Lense Liability Analysis Learning Objectives 1. Crente a pivot table in Excel 2. Add new calculated field to pivol tuble 3. Create a bar chan without and with line graph 4. Apply appropniate numerio format on pivot tables and charts 5. Analyze and interpret ourcome of pivot tables and calculated fields 6. Wring Data Set Background In the role as an analyst, you are asked to examine the financial metrics of two publicly traded companies, Feelcy Corporation and Holmes Company. In this project, you will examine the companies" pattern of leasing facilities, their transition to the new lease accounting standard in 2019, and the effect of that transition on debt covenants. The data set contains the elemerts of the balances of both companies for 10 years, 2012 through 2021. Since 2019, operuting leases have been reported in the balance sheet of the lessec as an rigf ff use asset and lease liability. Many companies at the time had debt covenants restricting the 5 amount of debt during loan periods. Feeley Corporation and Holmes Company had as part of their loan agreements a requirement that the debt-to-equity ratio could not exeeed 2.0 without being in default of the loans. The debt-to-equity ratio provides users of the financial statements an indication of the likelihood a company will default on its obligations. Requirements: 1. Create a pivot table to summarize the long-tern pertion of the (a) capital lease liability, (b) the finance lease liability, and (c) the opernting lease liability over the 10-year period 2012-2021 on a separaic worksheet. The data should be summarized by cach company for all relevant years. Label the worksheet 'Lease Liability' 2. On the 'Leuse Liability' warksheet create a pivot cluster column chart of the trends for long-term portion of each lease liability classification over the 10-year period classification. Each company's data for each year should be displayed side by side 3. Create a pivot table to summarize the total assets, total liabilities, and total stockholden: equrty over the 10-year period 2012-2021 (Hint: Need to calenlate total liabilities and total blockholders" cquity for each year) on a separate workshect. Add calculated ficld to calculate the debt-to-equity ratio for each company (camed two decimal place) over the 10-year period 2012-2021. Label the worksheer 'DebrToEquiry'. 4. On the 'Debt ToEquity' workshect display the trend of the debi-to-equity ratio over the 10-year period 2012-2021 using a bar charn with line graph. Each company's datn for each year should be displayed in a scparate bar chart. AC 400 Intermediate Accounting III, Spring 2023 5. Based on your output, answer the following questions on a separate worksheet labeled "Responses": a. For each company, Feeley Corporation and Holmes Company indicated if their respective debt-to-equity ratio over the 10-year period (a) generally increasing, (b) roughly the same, or (c) generally decreasing from year to year over the 10-year period 2012-2021. b. For each company. Feeley Corporation and Holmes Company is their respective pattern of leasing facilities as evidenced by its capital lease liability (a) increasing, (b) decreasing, or (c) remaining relatively the same over the 10-y 5arc period 2012-2021. c. Are either or both companies, Feeley Corporation or Holmes Company technically in violation of its debt covenant during the period 10 -year period 20122021? 6. The worksheets should be formatted with appropriate numeric values using accounting format with zero decimals unless indicated othervise. B Excel Project 1 Lense Liability Analysis Learning Objectives 1. Crente a pivot table in Excel 2. Add new calculated field to pivol tuble 3. Create a bar chan without and with line graph 4. Apply appropniate numerio format on pivot tables and charts 5. Analyze and interpret ourcome of pivot tables and calculated fields 6. Wring Data Set Background In the role as an analyst, you are asked to examine the financial metrics of two publicly traded companies, Feelcy Corporation and Holmes Company. In this project, you will examine the companies" pattern of leasing facilities, their transition to the new lease accounting standard in 2019, and the effect of that transition on debt covenants. The data set contains the elemerts of the balances of both companies for 10 years, 2012 through 2021. Since 2019, operuting leases have been reported in the balance sheet of the lessec as an rigf ff use asset and lease liability. Many companies at the time had debt covenants restricting the 5 amount of debt during loan periods. Feeley Corporation and Holmes Company had as part of their loan agreements a requirement that the debt-to-equity ratio could not exeeed 2.0 without being in default of the loans. The debt-to-equity ratio provides users of the financial statements an indication of the likelihood a company will default on its obligations. Requirements: 1. Create a pivot table to summarize the long-tern pertion of the (a) capital lease liability, (b) the finance lease liability, and (c) the opernting lease liability over the 10-year period 2012-2021 on a separaic worksheet. The data should be summarized by cach company for all relevant years. Label the worksheet 'Lease Liability' 2. On the 'Leuse Liability' warksheet create a pivot cluster column chart of the trends for long-term portion of each lease liability classification over the 10-year period classification. Each company's data for each year should be displayed side by side 3. Create a pivot table to summarize the total assets, total liabilities, and total stockholden: equrty over the 10-year period 2012-2021 (Hint: Need to calenlate total liabilities and total blockholders" cquity for each year) on a separate workshect. Add calculated ficld to calculate the debt-to-equity ratio for each company (camed two decimal place) over the 10-year period 2012-2021. Label the worksheer 'DebrToEquiry'. 4. On the 'Debt ToEquity' workshect display the trend of the debi-to-equity ratio over the 10-year period 2012-2021 using a bar charn with line graph. Each company's datn for each year should be displayed in a scparate bar chart. AC 400 Intermediate Accounting III, Spring 2023 5. Based on your output, answer the following questions on a separate worksheet labeled "Responses": a. For each company, Feeley Corporation and Holmes Company indicated if their respective debt-to-equity ratio over the 10-year period (a) generally increasing, (b) roughly the same, or (c) generally decreasing from year to year over the 10-year period 2012-2021. b. For each company. Feeley Corporation and Holmes Company is their respective pattern of leasing facilities as evidenced by its capital lease liability (a) increasing, (b) decreasing, or (c) remaining relatively the same over the 10-y 5arc period 2012-2021. c. Are either or both companies, Feeley Corporation or Holmes Company technically in violation of its debt covenant during the period 10 -year period 20122021? 6. The worksheets should be formatted with appropriate numeric values using accounting format with zero decimals unless indicated othervise. B