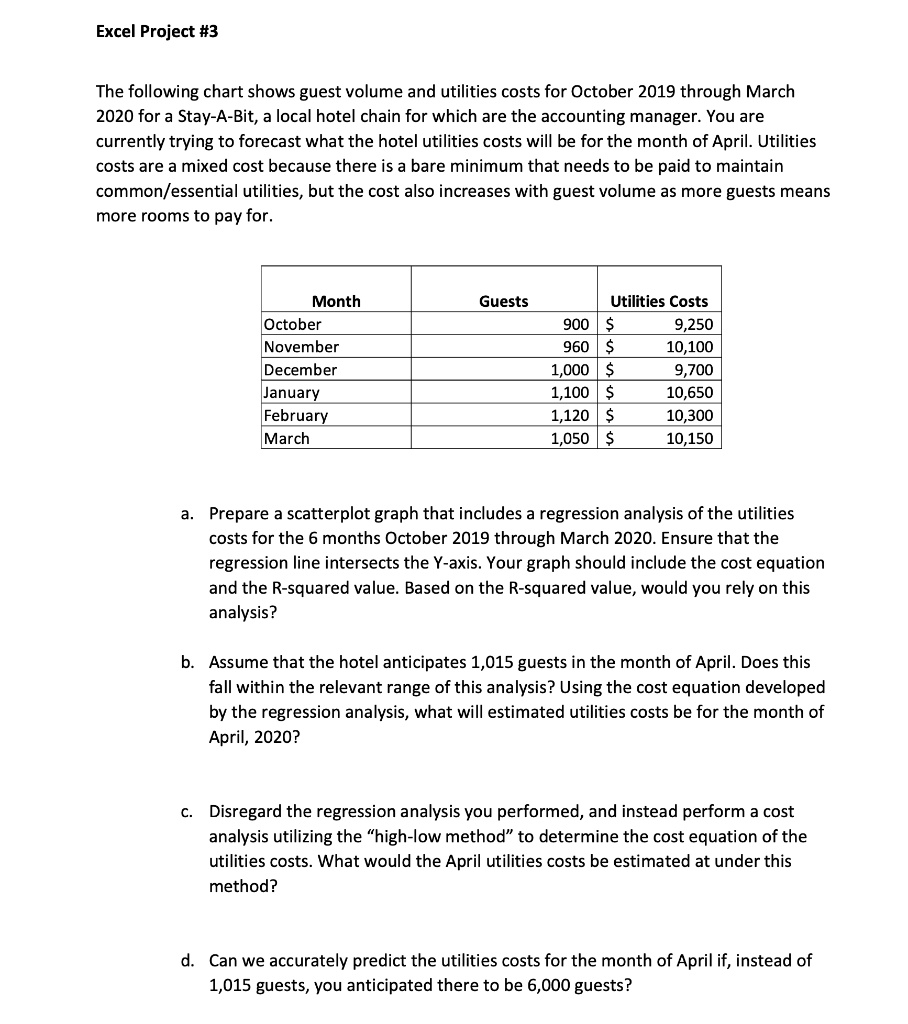
Excel Project #3 The following chart shows guest volume and utilities costs for October 2019 through March 2020 for a Stay-A-Bit, a local hotel chain for which are the accounting manager. You are currently trying to forecast what the hotel utilities costs will be for the month of April. Utilities costs are a mixed cost because there is a bare minimum that needs to be paid to maintain common/essential utilities, but the cost also increases with guest volume as more guests means more rooms to pay for. Guests Month October November December January February March | Utilities Costs 900 $ 9,250 960 $ 10,100 1,000 $ 9,700 1,100 $ 10,650 1,120 $ 10,300 1,050 $ 10,150 a. Prepare a scatterplot graph that includes a regression analysis of the utilities costs for the 6 months October 2019 through March 2020. Ensure that the regression line intersects the Y-axis. Your graph should include the cost equation and the R-squared value. Based on the R-squared value, would you rely on this analysis? b. Assume that the hotel anticipates 1,015 guests in the month of April. Does this fall within the relevant range of this analysis? Using the cost equation developed by the regression analysis, what will estimated utilities costs be for the month of April, 2020? C. Disregard the regression analysis you performed, and instead perform a cost analysis utilizing the "high-low method" to determine the cost equation of the utilities costs. What would the April utilities costs be estimated at under this method? d. Can we accurately predict the utilities costs for the month of April if, instead of 1,015 guests, you anticipated there to be 6,000 guests? Excel Project #3 The following chart shows guest volume and utilities costs for October 2019 through March 2020 for a Stay-A-Bit, a local hotel chain for which are the accounting manager. You are currently trying to forecast what the hotel utilities costs will be for the month of April. Utilities costs are a mixed cost because there is a bare minimum that needs to be paid to maintain common/essential utilities, but the cost also increases with guest volume as more guests means more rooms to pay for. Guests Month October November December January February March | Utilities Costs 900 $ 9,250 960 $ 10,100 1,000 $ 9,700 1,100 $ 10,650 1,120 $ 10,300 1,050 $ 10,150 a. Prepare a scatterplot graph that includes a regression analysis of the utilities costs for the 6 months October 2019 through March 2020. Ensure that the regression line intersects the Y-axis. Your graph should include the cost equation and the R-squared value. Based on the R-squared value, would you rely on this analysis? b. Assume that the hotel anticipates 1,015 guests in the month of April. Does this fall within the relevant range of this analysis? Using the cost equation developed by the regression analysis, what will estimated utilities costs be for the month of April, 2020? C. Disregard the regression analysis you performed, and instead perform a cost analysis utilizing the "high-low method" to determine the cost equation of the utilities costs. What would the April utilities costs be estimated at under this method? d. Can we accurately predict the utilities costs for the month of April if, instead of 1,015 guests, you anticipated there to be 6,000 guests