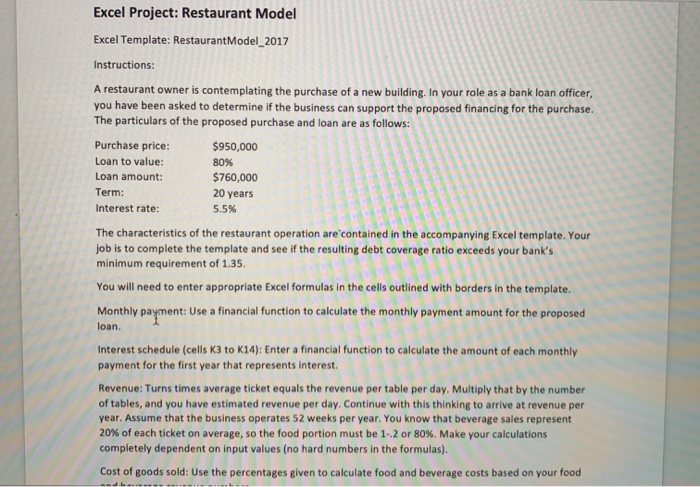
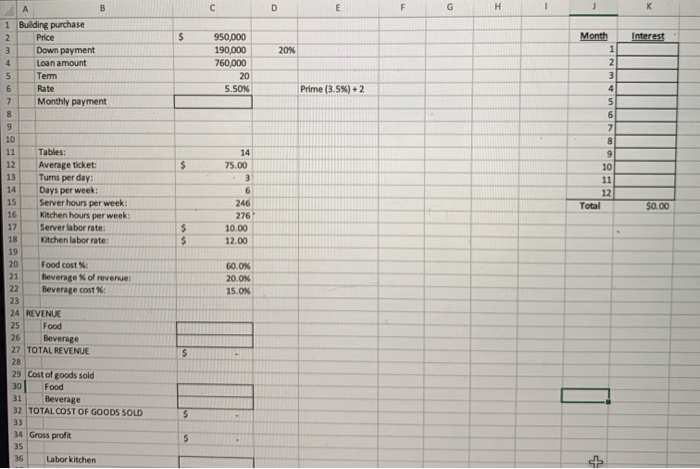
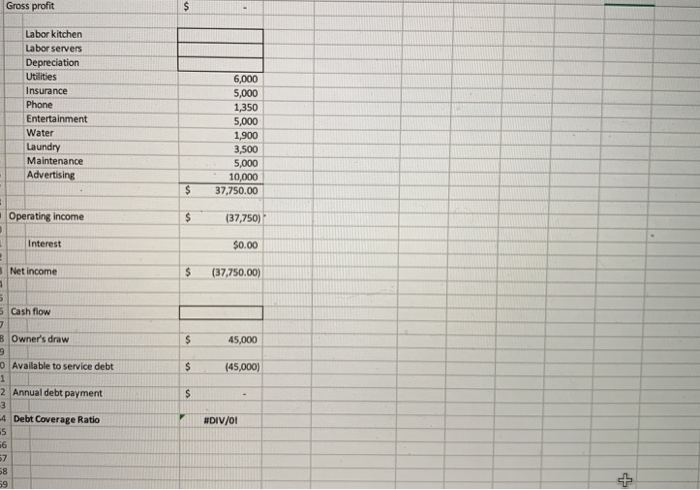
Excel Project: Restaurant Model Excel Template: RestaurantModel_2017 Instructions: A restaurant owner is contemplating the purchase of a new building. In your role as a bank loan officer, you have been asked to determine if the business can support the proposed financing for the purchase. The particulars of the proposed purchase and Purchase price: $950,000 Loan to value: 80% Loan amount: $760,000 Term: 20 years Interest rate: 5.5% 30 The characteristics of the restaurant operation are contained in the accompanying Excel template. Your job is to complete the template and see if the resulting debt coverage ratio exceeds your bank's minimum requirement of 1.35. You will need to enter appropriate Excel formulas in the cells outlined with borders in the template. Monthly payment: Use a financial function to calculate the monthly payment amount for the proposed loan. Interest schedule (cells K3 to K14): Enter a financial function to calculate the amount of each monthly payment for the first year that represents interest. Revenue: Turns times average ticket equals the revenue per table per day. Multiply that by the number of tables, and you have estimated revenue per day. Continue with this thinking to arrive at revenue per year. Assume that the business operates 52 weeks per year. You know that beverage sales represent 20% of each ticket on average, so the food portion must be 1-2 or 80%. Make your calculations completely dependent on input values (no hard numbers in the formulas). Cost of goods sold: Use the percentages given to calculate food and beverage costs based on your food Cost of goods sold: Use the percentages given to calculate food and beverage costs based on your food and beverage revenue numbers. Labor: Use the weekly hours and labor rates given to calculate kitchen and server labor costs. Depreciation: Use an Excel function to calculate the annual depreciation on the proposed building Assume straight line depreciation for a period of 30 years. There is no salvage value. Cash flow: Calculate cash flow as Net income + Interest + Depreciation. When all of these entries have been made, the template will calculate the debt coverage ratio 1 Month Building purchase Price Down payment Loan amount Term Rate Monthly payment 950,000 190,000 760,000 20% 20 5.50% Prime (3.5%) + 2 14 75.00 Tables: Average ticket: Turns per day: Days per week: Server hours per week: Kitchen hours per week: Server labor rate: Kitchen labor rate: 246 Total $0.00 276 10.00 12.00 Food cost : Beverage of revenue Beverage cost : 60.0% 20.0% 15.0% 24 REVENUE Food Beverage 27 TOTAL REVENUE 29 Cost of goods sold 30 Food 31 Beverage 32 TOTAL COST OF GOODS SOLD 34 Gross profit 36 Labor kitchen Gross profit Labor kitchen Labor servers Depreciation Utilities Insurance Phone Entertainment Water Laundry Maintenance Advertising 6,000 5,000 1,350 5,000 1,900 3,500 5,000 10,000 37,750.00 $ Operating income (37,750) $0.00 Net income $ (37,750.00) 5 Cash flow B Owner's draw 45,000 Available to service debt (45,000) 2 Annual debt payment -4 Debt Coverage Ratio #DIV/0


