Excel Question


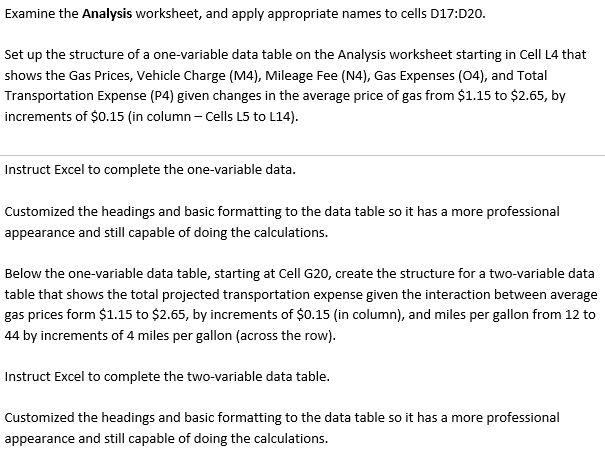
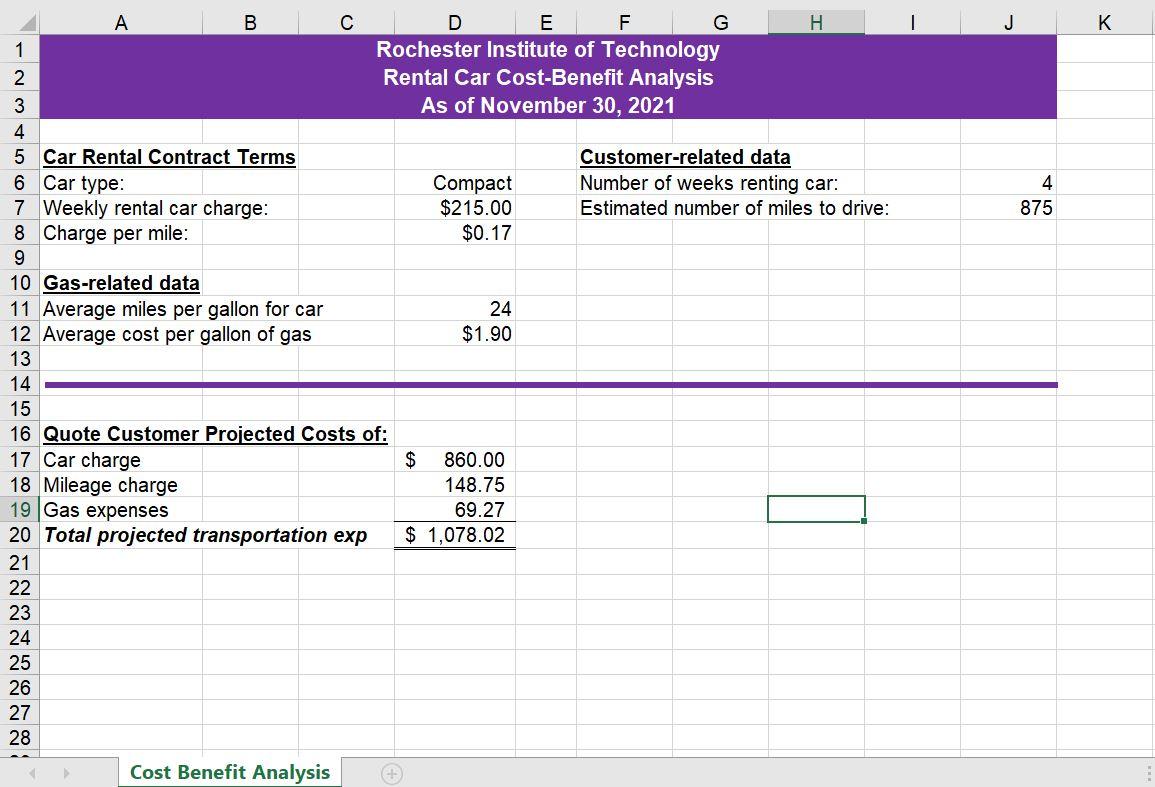
Examine the Analysis worksheet, and apply appropriate names to cells D17:D20. Set up the structure of a one-variable data table on the Analysis worksheet starting in Cell L4 that shows the Gas Prices, Vehicle Charge (M4), Mileage Fee (N4), Gas Expenses (04), and Total Transportation Expense (P4) given changes in the average price of gas from $1.15 to $2.65, by increments of $0.15 (in column - Cells L5 to L14). Instruct Excel to complete the one-variable data. Customized the headings and basic formatting to the data table so it has a more professional appearance and still capable of doing the calculations. Below the one-variable data table, starting at Cell G20, create the structure for a two-variable data table that shows the total projected transportation expense given the interaction between average gas prices form $1.15 to $2.65, by increments of $0.15 (in column), and miles per gallon from 12 to 44 by increments of 4 miles per gallon (across the row). Instruct Excel to complete the two-variable data table. Customized the headings and basic formatting to the data table so it has a more professional appearance and still capable of doing the calculations. J K 4 875 A B C D E F G H 1 Rochester Institute of Technology 2 Rental Car Cost-Benefit Analysis 3 As of November 30, 2021 4 5 Car Rental Contract Terms Customer-related data 6 Car type: Compact Number of weeks renting car: 7 Weekly rental car charge: $215.00 Estimated number of miles to drive: 8 Charge per mile: $0.17 9 10 Gas-related data 11 Average miles per gallon for car 24 12 Average cost per gallon of gas $1.90 13 14 15 16 Quote Customer Projected Costs of: 17 Car charge $ 860.00 18 Mileage charge 148.75 19 Gas expenses 69.27 20 Total projected transportation exp $ 1,078.02 21 22 23 24 25 26 27 28 Cost Benefit Analysis + Examine the Analysis worksheet, and apply appropriate names to cells D17:D20. Set up the structure of a one-variable data table on the Analysis worksheet starting in Cell L4 that shows the Gas Prices, Vehicle Charge (M4), Mileage Fee (N4), Gas Expenses (04), and Total Transportation Expense (P4) given changes in the average price of gas from $1.15 to $2.65, by increments of $0.15 (in column - Cells L5 to L14). Instruct Excel to complete the one-variable data. Customized the headings and basic formatting to the data table so it has a more professional appearance and still capable of doing the calculations. Below the one-variable data table, starting at Cell G20, create the structure for a two-variable data table that shows the total projected transportation expense given the interaction between average gas prices form $1.15 to $2.65, by increments of $0.15 (in column), and miles per gallon from 12 to 44 by increments of 4 miles per gallon (across the row). Instruct Excel to complete the two-variable data table. Customized the headings and basic formatting to the data table so it has a more professional appearance and still capable of doing the calculations. J K 4 875 A B C D E F G H 1 Rochester Institute of Technology 2 Rental Car Cost-Benefit Analysis 3 As of November 30, 2021 4 5 Car Rental Contract Terms Customer-related data 6 Car type: Compact Number of weeks renting car: 7 Weekly rental car charge: $215.00 Estimated number of miles to drive: 8 Charge per mile: $0.17 9 10 Gas-related data 11 Average miles per gallon for car 24 12 Average cost per gallon of gas $1.90 13 14 15 16 Quote Customer Projected Costs of: 17 Car charge $ 860.00 18 Mileage charge 148.75 19 Gas expenses 69.27 20 Total projected transportation exp $ 1,078.02 21 22 23 24 25 26 27 28 Cost Benefit Analysis +


