

Answered step by step
Verified Expert Solution
Question
1 Approved Answer
Excrcisc 5 (3 points) Difficulty Easy Create the following two functions in MATLAB function [1 polyplot (a,b,p) x-(a:(b-a)/50:b) y polyval(p,x); plot(x,y); end and function c
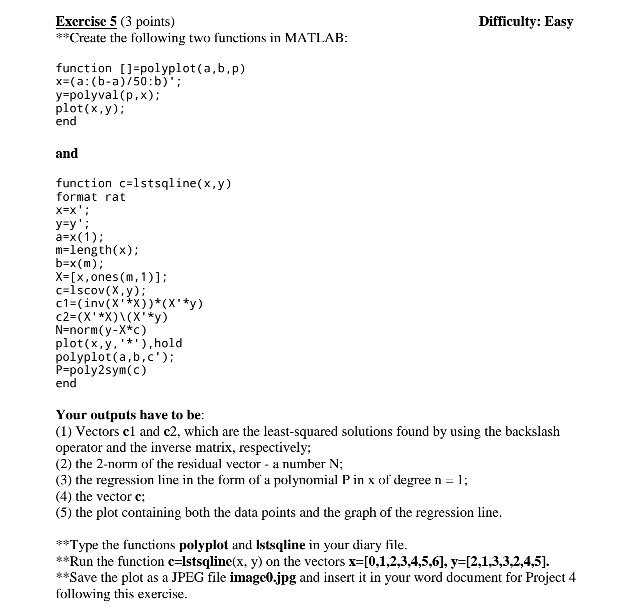
Excrcisc 5 (3 points) Difficulty Easy Create the following two functions in MATLAB function [1 polyplot (a,b,p) x-(a:(b-a)/50:b) y polyval(p,x); plot(x,y); end and function c lstsqline(x,y) format rat x=x' ; m length(x); b-x (m) X-[x,ones (m, 1)] c-1scov(X,y) N-norm(y-X*c) plot(x,y,,hold polyplot(a,b,c"): P-poly2sym(c) end Your outputs have to be (1) Vectors cl and c2, which are the least-squared solutions found by using the backslash operator and the inverse matrix, respectively; (2) the 2-norm of the residual vector a number N; (3) the regression line in the fom of a polynomial P in x of degree n (4) the vector c: (5) the plot containing both the data points and the graph of the regression line Type the functions polyplot and lstsqline in your diary file **Run the function c lstsqline(x. y) on the vectors x=[0.1,2,3 4,5.6], y 12,1,3,3 2,4,5]. *Save the plot as a JPEG file imagc0.jpg and insert it in your word document for Project 4 following this exercise
Step by Step Solution
There are 3 Steps involved in it
Step: 1

Get Instant Access to Expert-Tailored Solutions
See step-by-step solutions with expert insights and AI powered tools for academic success
Step: 2

Step: 3
Ace Your Homework with AI
Get the answers you need in no time with our AI-driven, step-by-step assistance
Get Started
Big Data 29th British National Conference On Databases Bncod 2013 Oxford Uk July 2013 Proceedings Lncs 7968
Authors: Dan Olteanu ,Georg Gottlob ,Christian Schallhart
2013th Edition
3642394663, 978-3642394669