

Question
Execise 6.2 Return to the permeability problem outlined in Exercise 6.2. Train several nonlinear regression models and evaluate the resampling and test set performance. (a)
Execise 6.2
Return to the permeability problem outlined in Exercise 6.2. Train several nonlinear regression models and evaluate the resampling and test set
performance.
(a) Which nonlinear regression model gives the optimal resampling and test
set performance?
(b) Do any of the nonlinear models outperform the optimal linear model you
previously developed in Exercise 6.2? If so, what might this tell you about
the underlying relationship between the predictors and the response?
7.5 Computing 171
(c) Would you recommend any of the models you have developed to replace
the permeability laboratory experiment?
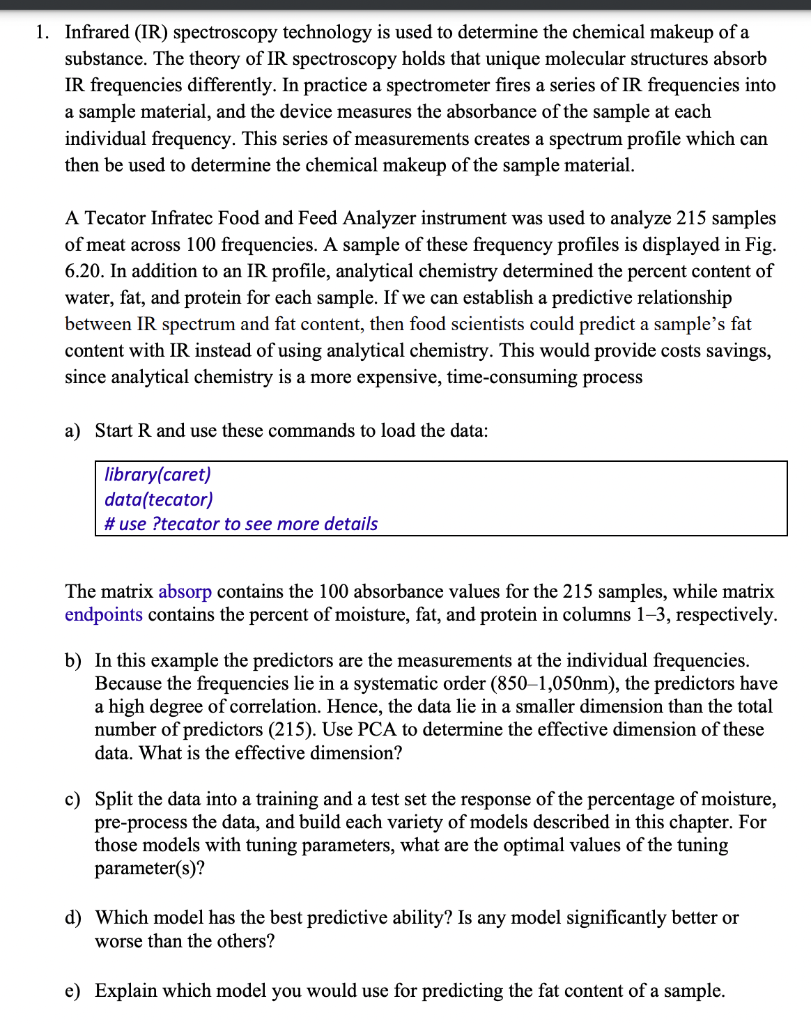
1. Infrared (IR) spectroscopy technology is used to determine the chemical makeup of a substance. The theory of IR spectroscopy holds that unique molecular structures absorb IR frequencies differently. In practice a spectrometer fires a series of IR frequencies into a sample material, and the device measures the absorbance of the sample at each individual frequency. This series of measurements creates a spectrum profile which can then be used to determine the chemical makeup of the sample material. A Tecator Infratec Food and Feed Analyzer instrument was used to analyze 215 samples of meat across 100 frequencies. A sample of these frequency profiles is displayed in Fig. 6.20. In addition to an IR profile, analytical chemistry determined the percent content of water, fat, and protein for each sample. If we can establish a predictive relationship between IR spectrum and fat content, then food scientists could predict a sample's fat content with IR instead of using analytical chemistry. This would provide costs savings, since analytical chemistry is a more expensive, time-consuming process a) Start R and use these commands to load the data: The matrix absorp contains the 100 absorbance values for the 215 samples, while matrix endpoints contains the percent of moisture, fat, and protein in columns 13, respectively. b) In this example the predictors are the measurements at the individual frequencies. Because the frequencies lie in a systematic order (8501,050nm), the predictors have a high degree of correlation. Hence, the data lie in a smaller dimension than the total number of predictors (215). Use PCA to determine the effective dimension of these data. What is the effective dimension? c) Split the data into a training and a test set the response of the percentage of moisture, pre-process the data, and build each variety of models described in this chapter. For those models with tuning parameters, what are the optimal values of the tuning parameter(s)? d) Which model has the best predictive ability? Is any model significantly better or worse than the others? e) Explain which model you would use for predicting the fat content of a sample
Step by Step Solution
There are 3 Steps involved in it
Step: 1

Get Instant Access to Expert-Tailored Solutions
See step-by-step solutions with expert insights and AI powered tools for academic success
Step: 2

Step: 3
Ace Your Homework with AI
Get the answers you need in no time with our AI-driven, step-by-step assistance
Get Started
Privacy In Statistical Databases Unesco Chair In Data Privacy International Conference Psd 2014 Ibiza Spain September 17 19 2014 Proceedings Lncs 8744
Authors: Josep Domingo-Ferrer
2014th Edition
3319112562, 978-3319112565