Exercise 1: Apply a constant force In this experiment, you will keep the net force constant while changing the mass of your system (mass+cart). To
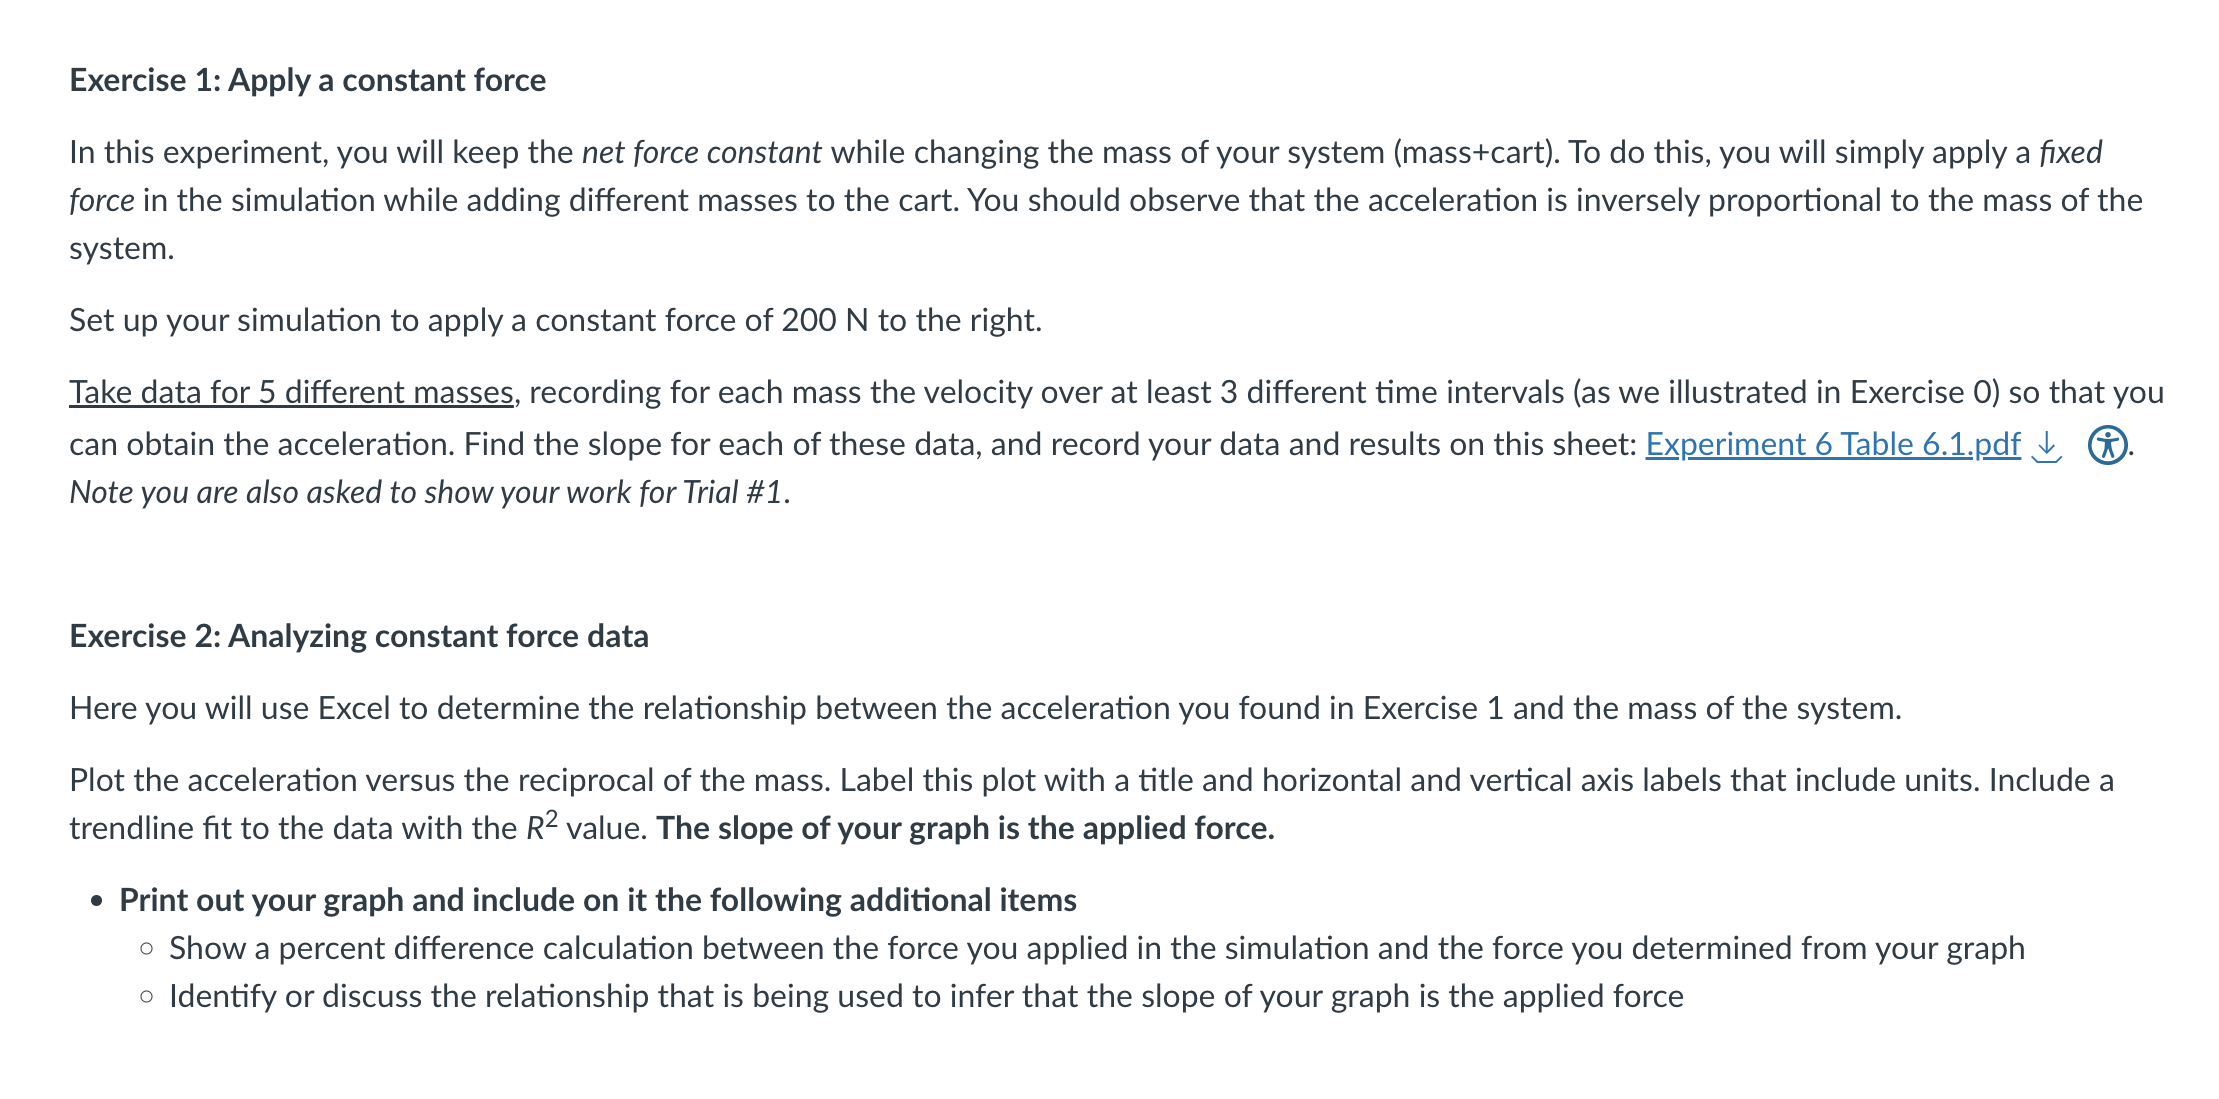
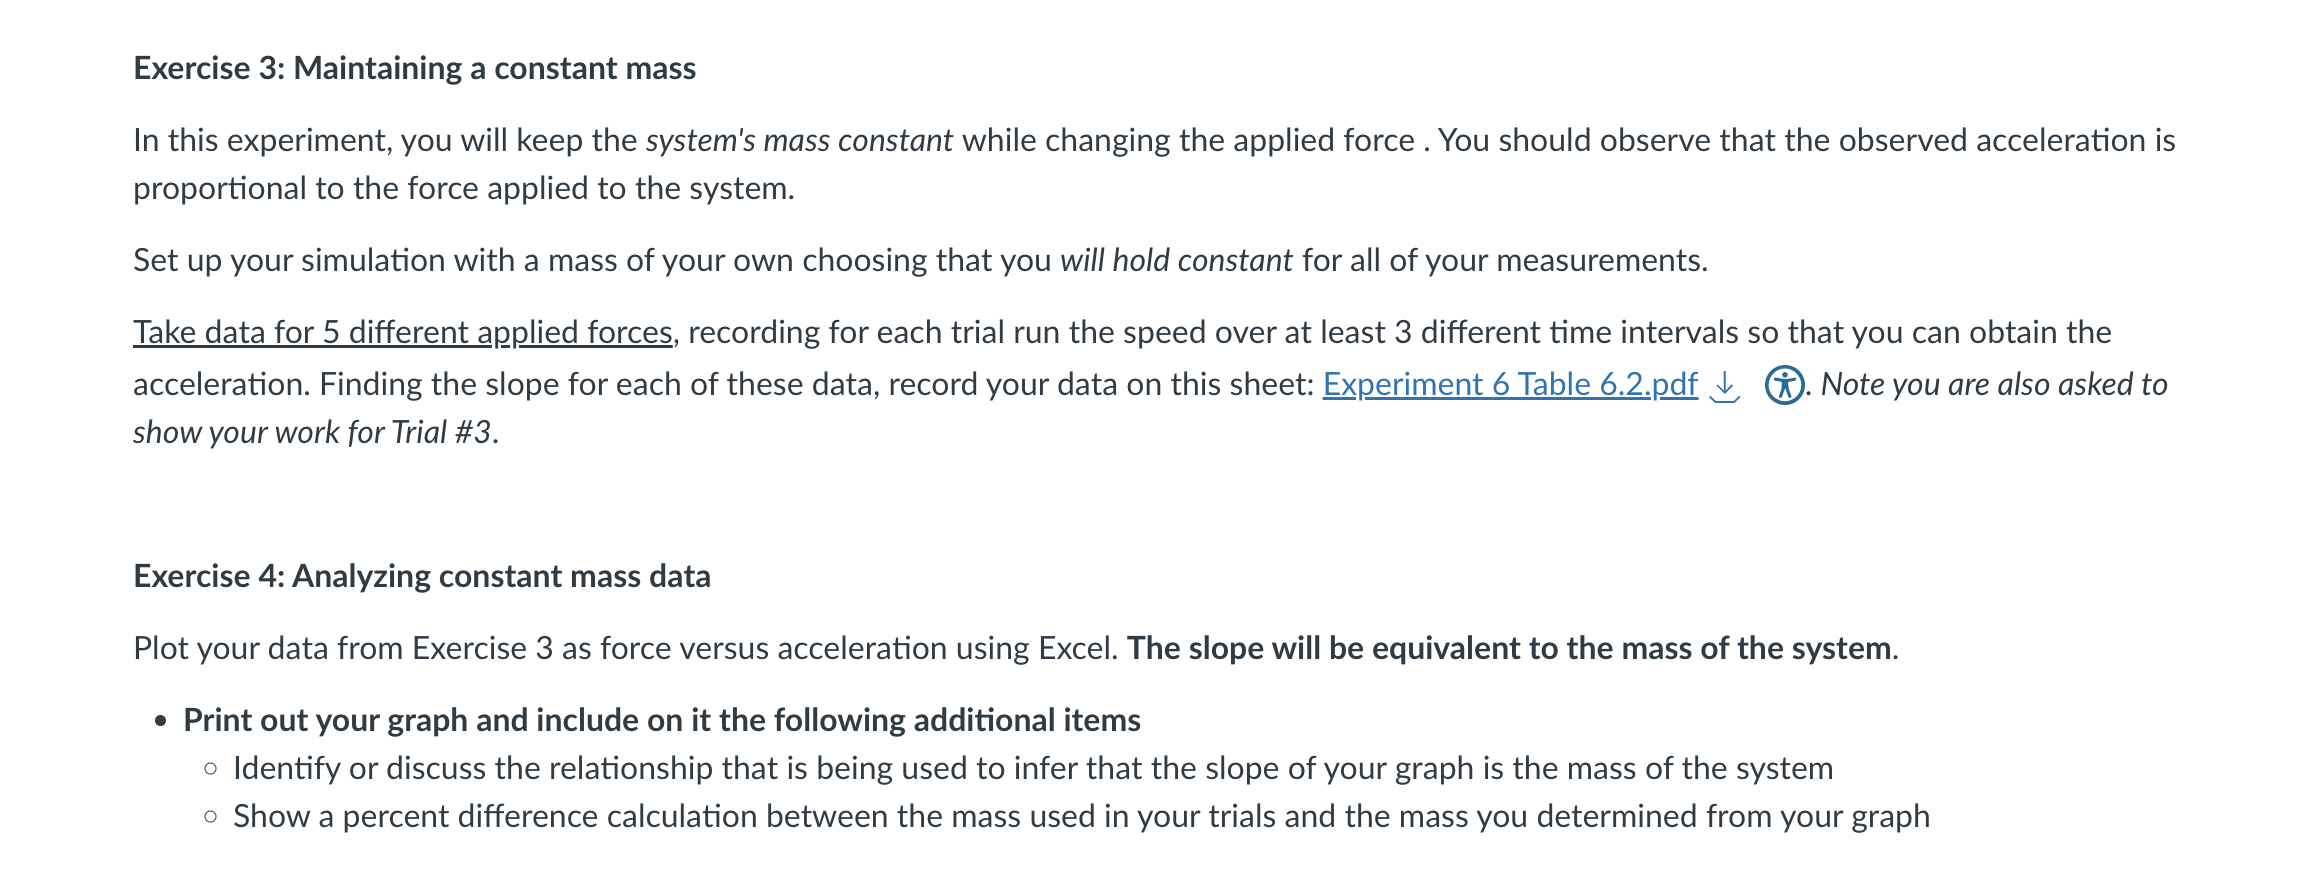
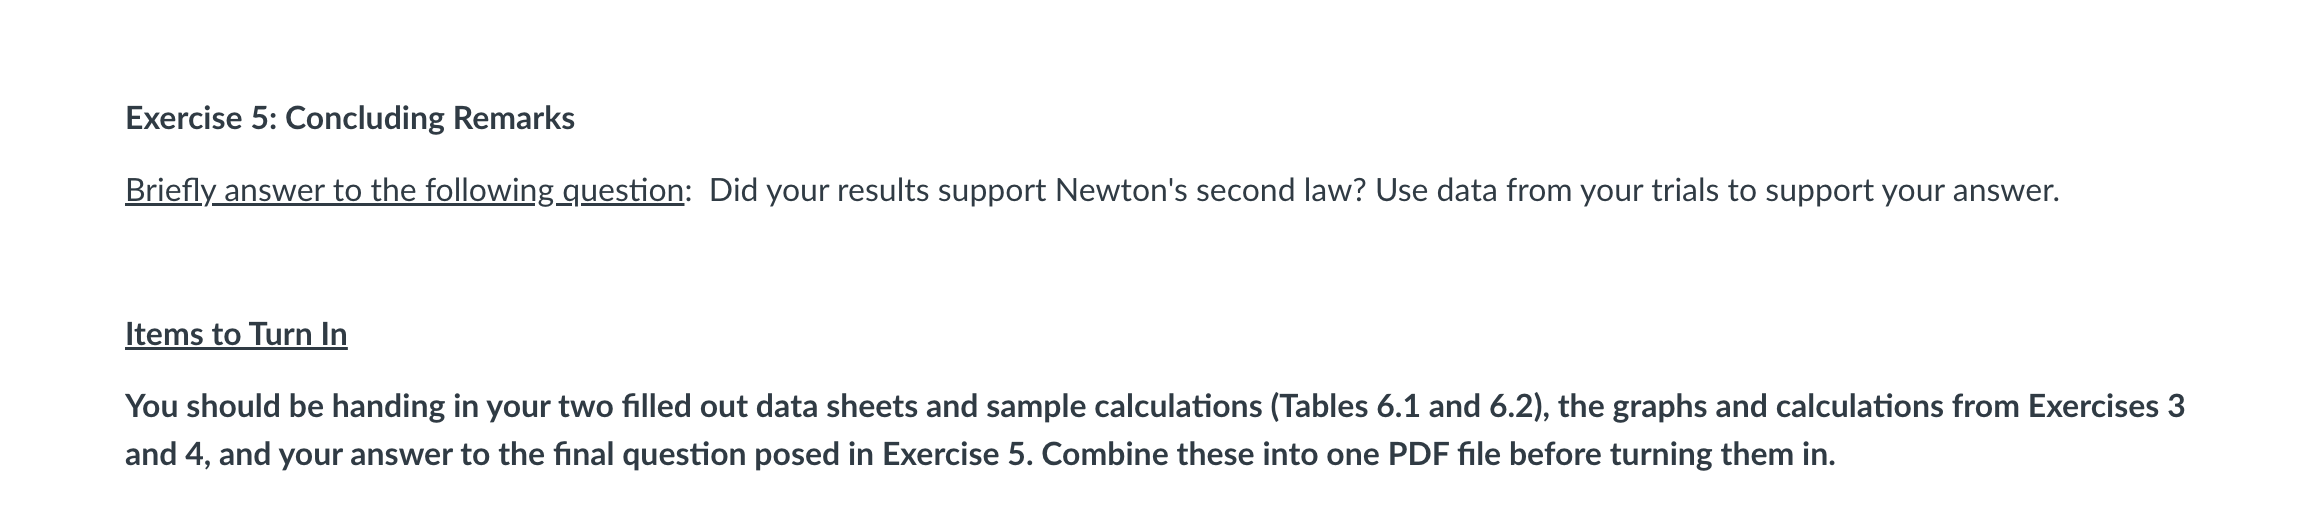
Exercise 1: Apply a constant force In this experiment, you will keep the net force constant while changing the mass of your system (mass+cart). To do this, you will simply apply a fixed force in the simulation while adding different masses to the cart. You should observe that the acceleration is inversely proportional to the mass of the system. Set up your simulation to apply a constant force of 200 N to the right. Take data for 5 different masses, recording for each mass the velocity over at least 3 different time intervals (as we illustrated in Exercise 0) so that you can obtain the acceleration. Find the slope for each of these data, and record your data and results on this sheet: Experiment 6 Table 6.1.pdf | @ Note you are also asked to show your work for Trial #1. Exercise 2: Analyzing constant force data Here you will use Excel to determine the relationship between the acceleration you found in Exercise 1 and the mass of the system. Plot the acceleration versus the reciprocal of the mass. Label this plot with a title and horizontal and vertical axis labels that include units. Include a trendline fit to the data with the R? value. The slope of your graph is the applied force. Print out your graph and include on it the following additional items o Show a percent difference calculation between the force you applied in the simulation and the force you determined from your graph o ldentify or discuss the relationship that is being used to infer that the slope of your graph is the applied force Exercise 3: Maintaining a constant mass In this experiment, you will keep the system's mass constant while changing the applied force . You should observe that the observed acceleration is proportional to the force applied to the system. Set up your simulation with a mass of your own choosing that you will hold constant for all of your measurements. Take data for 5 different applied forces, recording for each trial run the speed over at least 3 different time intervals so that you can obtain the acceleration. Finding the slope for each of these data, record your data on this sheet: Experiment 6 Table 6.2.pdf | @ Note you are also asked to show your work for Trial #3. Exercise 4: Analyzing constant mass data Plot your data from Exercise 3 as force versus acceleration using Excel. The slope will be equivalent to the mass of the system. Print out your graph and include on it the following additional items o ldentify or discuss the relationship that is being used to infer that the slope of your graph is the mass of the system o Show a percent difference calculation between the mass used in your trials and the mass you determined from your graph Exercise 5: Concluding Remarks Briefly answer to the following question: Did your results support Newton's second law? Use data from your trials to support your answer. Items to Turn In You should be handing in your two filled out data sheets and sample calculations (Tables 6.1 and 6.2), the graphs and calculations from Exercises 3 and 4, and your answer to the final question posed in Exercise 5. Combine these into one PDF file before turning them in
Step by Step Solution
There are 3 Steps involved in it
Step: 1
Get Instant Access to Expert-Tailored Solutions
See step-by-step solutions with expert insights and AI powered tools for academic success
Step: 2
Step: 3
Ace Your Homework with AI
Get the answers you need in no time with our AI-driven, step-by-step assistance