

Question
EXERCISE (1) Compute a 95% confidence interval for the true mean lead content in the Sebring, OH water system. (2) Build an 80% confidence interval


EXERCISE
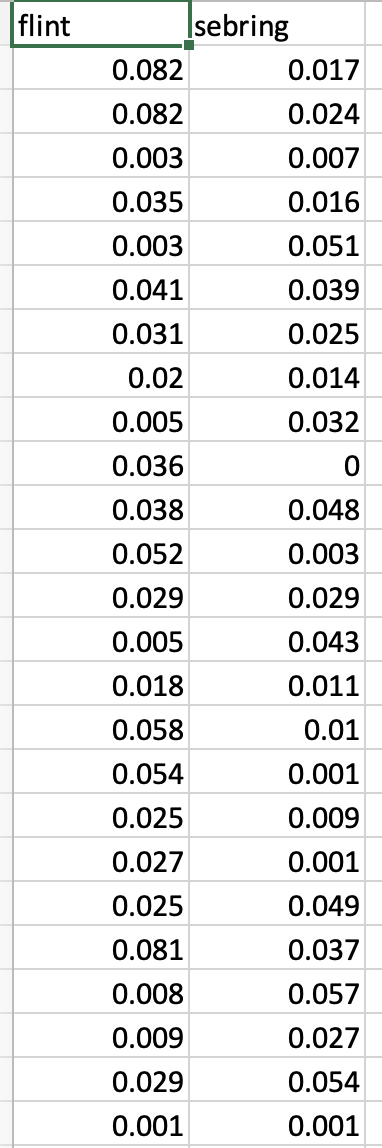
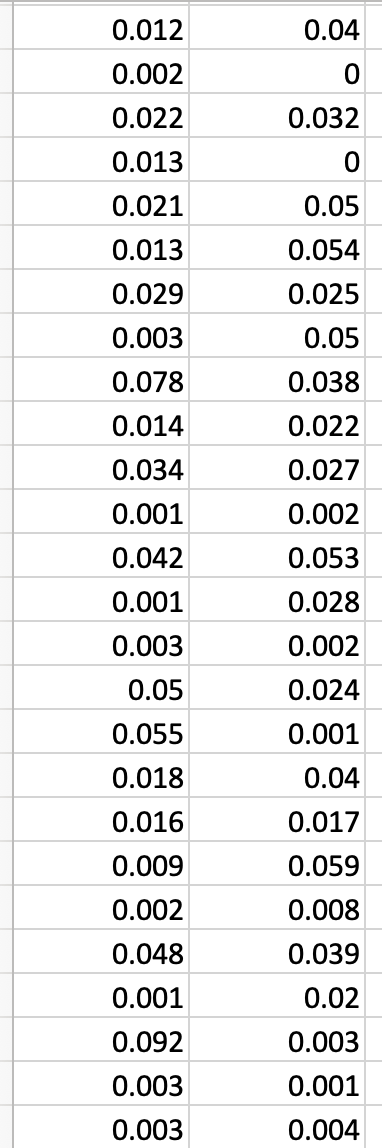
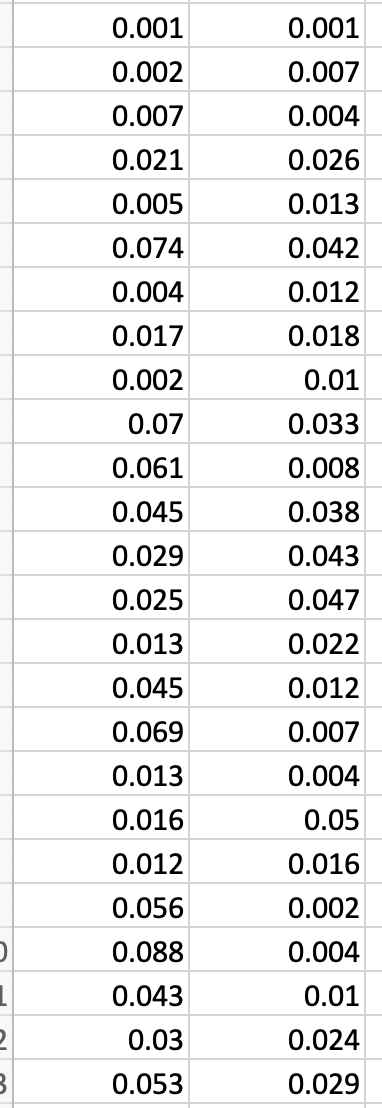
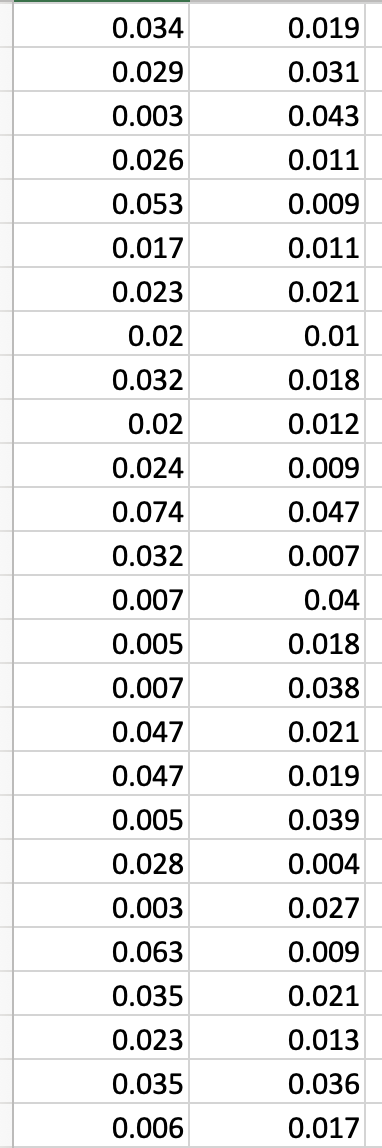
(1) Compute a 95% confidence interval for the true mean lead content in the Sebring, OH
water system.
(2) Build an 80% confidence interval for the mean lead concentration in the Sebring, OH
water supply. Use the t.test function.
(3) Conduct a hypothesis test that the proportion of minority visitors to Great Smokey
Mountains National Park (GSMNP) is also 13%. A survey of visitors showed 1,221
minorities out of 10,248 visitors.
(4) Build a 99% confidence interval for the proportion of minority visitors to Great
Smokey Mountains National Park (GSMNP). A survey of visitors showed 1,221 minorities
out of 10,248 visitors.
(5) Redo Exercise 3, but using binom.test. Comment on any differences in the results
between prop.test and binom.test in terms of the hypothesis test and the confidence
interval.


Step by Step Solution
There are 3 Steps involved in it
Step: 1

Get Instant Access to Expert-Tailored Solutions
See step-by-step solutions with expert insights and AI powered tools for academic success
Step: 2

Step: 3
Ace Your Homework with AI
Get the answers you need in no time with our AI-driven, step-by-step assistance
Get Started
Mathematical Analysis And Its Applications Roorkee, India, December 2014
Authors: P N Agrawal, R N Mohapatra, Uaday Singh, H M Srivastava
1st Edition
813222485X, 9788132224853