Answered step by step
Verified Expert Solution
Question
1 Approved Answer
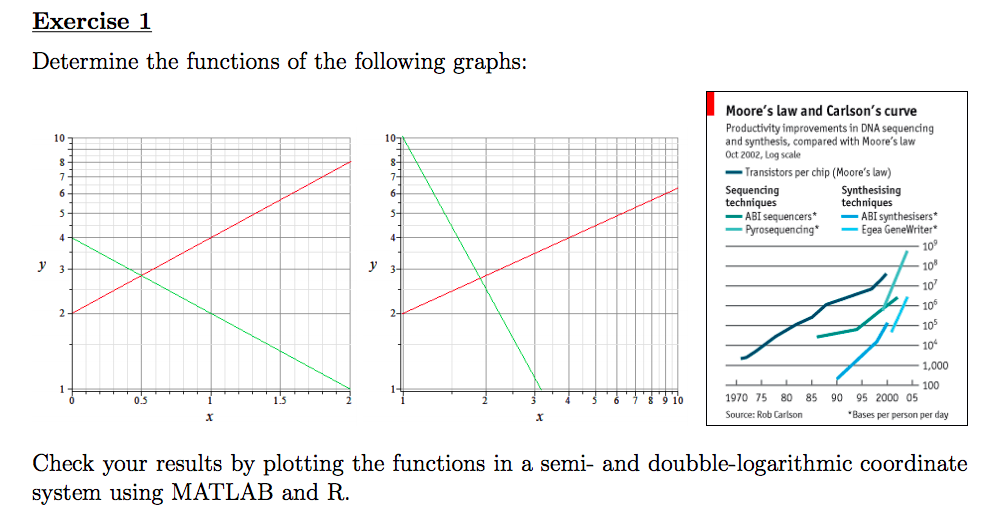
Exercise 1 Determine the functions of the following graphs: Moore's law and Carlson's curve Productivity improvements in DNA sequencing and synthesis, compared with Moore's law

Exercise 1 Determine the functions of the following graphs: Moore's law and Carlson's curve Productivity improvements in DNA sequencing and synthesis, compared with Moore's law Oct 2002, Log scale 10 T 101 Transistors per chip (Moore's law) Sequencing techniques -ABI sequencers*ABI symthesisers Synthesising technique Pyrosequencing Egea GeneWriter 109 10 105 105 10 1,000 100 3 4367 9 10 1970 75 80 85 90 95 2000 05 Source: Rob Carlson 1.S Bases per person per day Check your results by plotting the functions in a semi- and doubble-logarithmic coordinate system using MATLAB and R. Exercise 1 Determine the functions of the following graphs: Moore's law and Carlson's curve Productivity improvements in DNA sequencing and synthesis, compared with Moore's law Oct 2002, Log scale 10 T 101 Transistors per chip (Moore's law) Sequencing techniques -ABI sequencers*ABI symthesisers Synthesising technique Pyrosequencing Egea GeneWriter 109 10 105 105 10 1,000 100 3 4367 9 10 1970 75 80 85 90 95 2000 05 Source: Rob Carlson 1.S Bases per person per day Check your results by plotting the functions in a semi- and doubble-logarithmic coordinate system using MATLAB and R
Step by Step Solution
There are 3 Steps involved in it
Step: 1

Get Instant Access to Expert-Tailored Solutions
See step-by-step solutions with expert insights and AI powered tools for academic success
Step: 2

Step: 3

Ace Your Homework with AI
Get the answers you need in no time with our AI-driven, step-by-step assistance
Get Started


