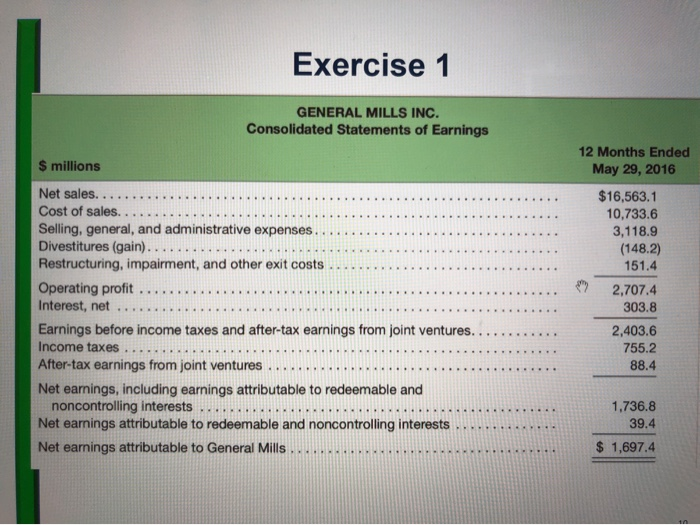
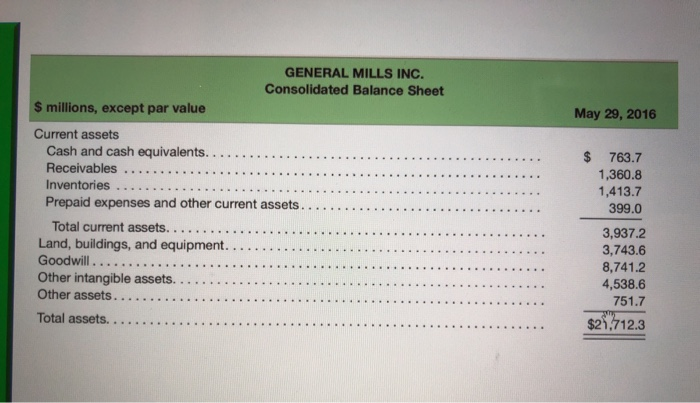
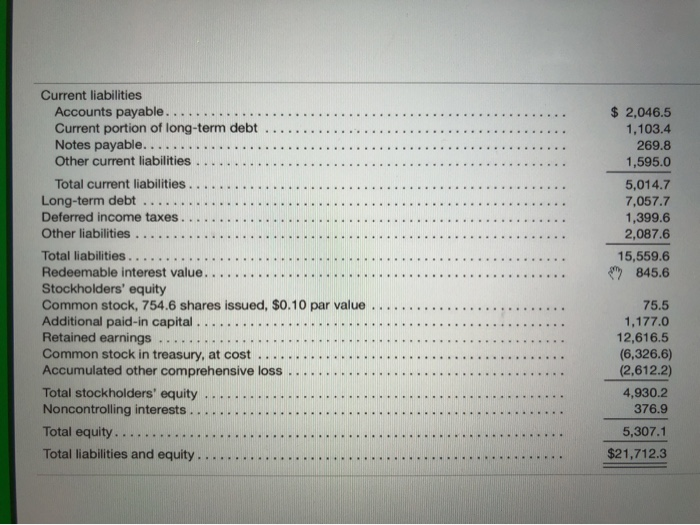
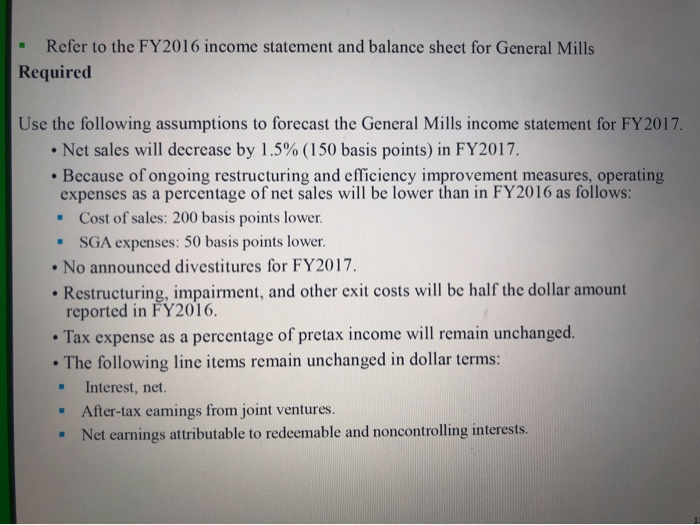
Exercise 1 GENERAL MILLS INC. Consolidated Statements of Earnings 12 Months Ended May 29, 2016 $ millions .... ....... $16,563.1 10,733.6 3,118.9 (148.2) 151.4 2,707.4 303.8 2,403.6 755.2 88.4 . Net sales.......... Cost of sales........ Selling, general, and administrative expenses.. Divestitures (gain)............ Restructuring, impairment, and other exit costs... Operating profit .......... Interest, net ....... Earnings before income taxes and after-tax earnings from joint ventures.. Income taxes ........ After-tax earnings from joint ventures ........ Net earnings, including earnings attributable to redeemable and noncontrolling interests ........ Net earnings attributable to redeemable and noncontrolling interests. Net earnings attributable to General Mills .... ........ 1.736.8 39.4 $ 1,697.4 GENERAL MILLS INC. Consolidated Balance Sheet $ millions, except par value May 29, 2016 Current assets Cash and cash equivalents.......... Receivables ....... Inventories .............. Prepaid expenses and other current assets... Total current assets..... Land, buildings, and equipment.... Goodwill ......... Other intangible assets. Other assets................. Total assets. ......... $ 763.7 1,360.8 1,413.7 399.0 3,937.2 3,743.6 8,741.2 4,538.6 751.7 $21,712.3 Current liabilities Accounts payable........ Current portion of long-term debt .... Notes payable.... Other current liabilities. Total current liabilities. Long-term debt ..... Deferred income taxes.. Other liabilities ........ Total liabilities. ....... Redeemable interest value. Stockholders' equity Common stock, 754.6 shares issued, $0.10 par value ..... Additional paid-in capital... Retained earnings ....... Common stock in treasury, at cost .... Accumulated other comprehensive loss. Total stockholders' equity .. Noncontrolling interests ... Total equity... Total liabilities and equity. $ 2,046.5 1,103.4 269.8 1,595.0 5,014.7 7,057.7 1,399.6 2,087.6 15,559.6 845.6 75.5 1,177.0 12,616.5 (6,326.6) (2,612.2) 4,930.2 376.9 5,307.1 $21,712.3 . Refer to the FY2016 income statement and balance sheet for General Mills! Required Use the following assumptions to forecast the General Mills income statement for FY2017. Net sales will decrease by 1.5% (150 basis points) in FY2017. . Because of ongoing restructuring and efficiency improvement measures, operating expenses as a percentage of net sales will be lower than in FY2016 as follows: Cost of sales: 200 basis points lower. - SGA expenses: 50 basis points lower. No announced divestitures for FY2017. Restructuring, impairment, and other exit costs will be half the dollar amount reported in FY2016. Tax expense as a percentage of pretax income will remain unchanged. The following line items remain unchanged in dollar terms: Interest, net. - After-tax eamings from joint ventures. Net earnings attributable to redeemable and noncontrolling interests. 10
