

Answered step by step
Verified Expert Solution
Question
1 Approved Answer
Exercise 1: Graphing the Demand Curve. Use the data presented in the Demand Schedule for CDs to graph the demand curve in the chart below.
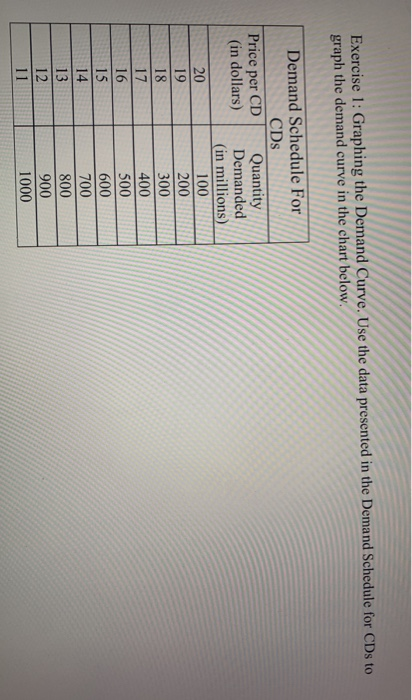
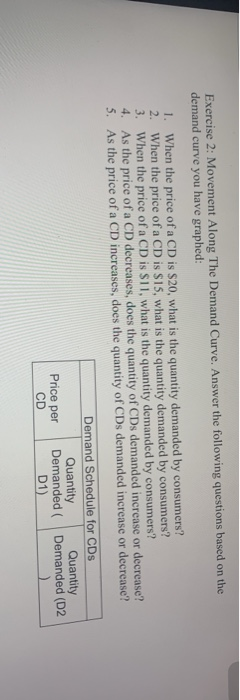
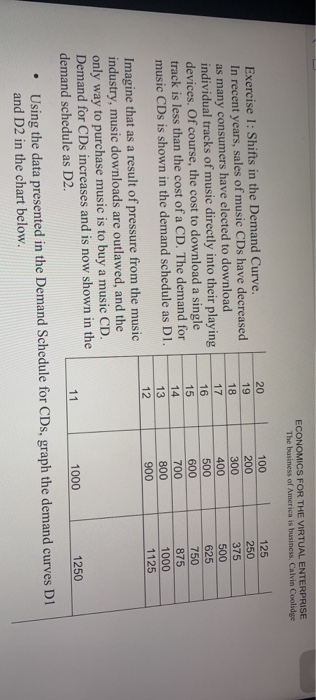
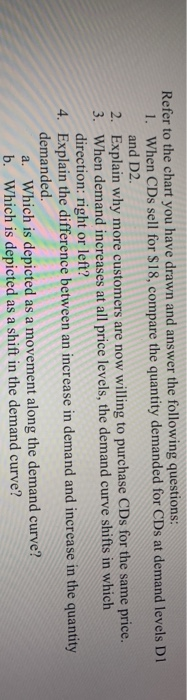 Exercise 1: Graphing the Demand Curve. Use the data presented in the Demand Schedule for CDs to graph the demand curve in the chart below. Demand Schedule For CDs Price per CD Quantity (in dollars) Demanded (in millions) 20 100 19 200 18 300 17 400 16 500 15 600 14 700 13 800 12 900 11 1000 Exercise 2: Movement Along The Demand Curve. Answer the following questions based on the demand curve you have graphed: 1. When the price of a CD is $20, what is the quantity demanded by consumers? 2. When the price of a CD is $15, what is the quantity demanded by consumers? 3. When the price of a CD is SI1, what is the quantity demanded by consumers? 4. As the price of a CD decreases, does the quantity of CDs demanded increase or decrease? 5. As the price of a CD increases, does the quantity of CDs demanded increase or decrease? Demand Schedule for CDs Quantity Quantity Demanded Demanded (D2 CD D1) Price per ECONOMICS FOR THE VIRTUAL ENTERPRISE The business of America is business, Calvin Coolidge Exercise 1: Shifts in the Demand Curve. In recent years, sales of music CDs have decreased as many consumers have elected to download individual tracks of music directly into their playing devices. Of course, the cost to download a single track is less than the cost of a CD. The demand for music CDs is shown in the demand schedule as DI. 20 19 18 17 16 15 14 13 12 100 200 300 400 500 600 700 800 900 125 250 375 500 625 750 875 1000 1125 Imagine that as a result of pressure from the music industry, music downloads are outlawed, and the only way to purchase music is to buy a music CD. Demand for CDs increases and is now shown in the demand schedule as D2. 11 1000 1250 Using the data presented in the Demand Schedule for CDs, graph the demand curves D1 and D2 in the chart below. Refer to the chart you have drawn and answer the following questions: 1. When CDs sell for $18, compare the quantity demanded for CDs at demand levels D1 and D2. 2. Explain why more customers are now willing to purchase CDs for the same price. 3. When demand increases at all price levels, the demand curve shifts in which direction: right or left? 4. Explain the difference between an increase in demand and increase in the quantity demanded. a. Which is depicted as a movement along the demand curve? b. Which is depicted as a shift in the demand curve
Step by Step Solution
There are 3 Steps involved in it
Step: 1

Get Instant Access to Expert-Tailored Solutions
See step-by-step solutions with expert insights and AI powered tools for academic success
Step: 2

Step: 3
Ace Your Homework with AI
Get the answers you need in no time with our AI-driven, step-by-step assistance
Get Started
Why CISOs Fail Internal Audit And IT Audit The Missing Link In Security Management How To Fix It
Authors: Barak Engel
1st Edition
1138197890, 978-1138197893