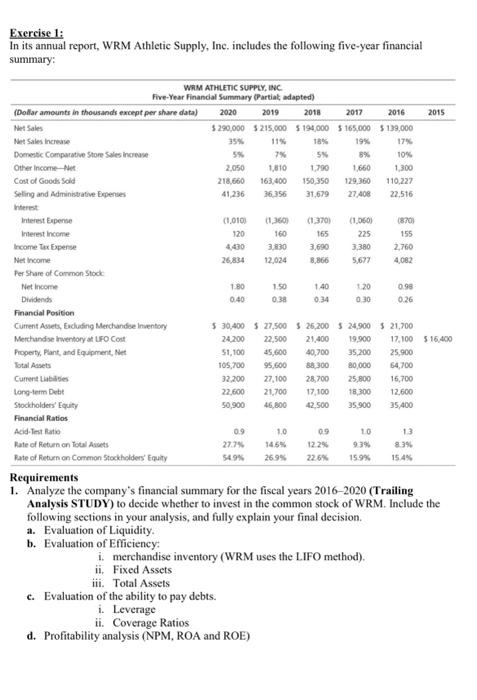
Exercise 1: In its annual report, WRM Athletic Supply, Inc. includes the following five-year financial summary: 2015 WAM ATHLETIC SUPPLY, INC Five-Year Financial Summary Partiat adapted) (Dollar amounts in thousands except per share data) 2020 2019 2018 2017 2016 Net Sales 5 290,000 $215,000 5 194,000 $165,000 $139,000 Net Sales Increase 35% 18% 19% 17% Domestic Comparative Store Sales in 5% 7% 5% 8% 10% Other Income-Net 2,050 1,810 1.790 1660 1.300 Cost of Goods Sold 218,660 163.000 150350 129,360 110,227 Seling and Administrative Expenses 41,236 36.356 31,679 27408 22,516 (160 160 Interest Expense (1.010) (1,3701 (1,0601 8701 Interest Income 120 165 225 155 Income Tax Expense 400 3,30 3,690 3.380 2.760 Net Income 26.834 12,024 8.866 5,677 4,082 Per Share of Common Stock Net Income 1.80 1.50 140 120 0.90 Dividends 0.40 0.38 0.34 0.30 0.26 Financial Position Current Assets, Enduding Merchandise Inventory 5 30,400 5 27,500 $ 26,200 $ 24,900 $ 21,700 Merchandise inventory at UFO Cost 24200 22.500 21.400 19,900 17,100 516.400 Property, plant, and Equipment, et 51,100 45,600 40,700 35,200 25.900 Totalets 105,700 95,600 38300 80,000 54,700 Current Libilities 32.200 27.100 28,700 25,800 16,700 Long-tem Debt 22.600 21,700 17,100 18,300 12,600 Stockholders' Equity 50.900 46,800 42.500 35.900 35,400 Financial Ratios Acid-Test Ratio 0.9 1.0 10 13 Rate of Return on Total Assets 27.7 14.5% 122 8:39 Rate of Return on Common Stockholders' Equity 54.9% 26.9% 22.6% 15.9% 15.4% Requirements 1. Analyze the company's financial summary for the fiscal years 2016-2020 (Trailing Analysis STUDY) to decide whether to invest in the common stock of WRM. Include the following sections in your analysis, and fully explain your final decision. a. Evaluation of Liquidity. b. Evaluation of Efficiency i. merchandise inventory (WRM uses the LIFO method) ii. Fixed Assets iii. Total Assets c. Evaluation of the ability to pay debts. i. Leverage ii. Coverage Ratios d. Profitability analysis (NPM, ROA and ROE) 09