

Answered step by step
Verified Expert Solution
Question
1 Approved Answer
Exercise 1 . Let r = 0 . 3 . Identify the inflow and outflow terms and save them as separate math functions. Plot these
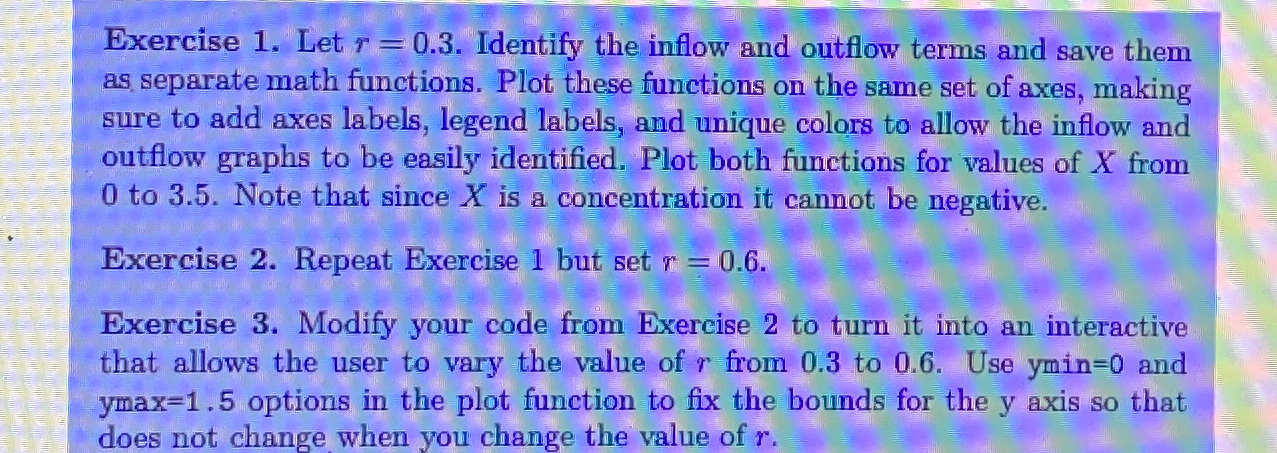
Exercise Let Identify the inflow and outflow terms and save them as separate math functions. Plot these functions on the same set of axes, making sure to add axes labels, legend labels, and unique colors to allow the inflow and outflow graphs to be easily identified. Plot both functions for values of from to Note that since is a concentration it cannot be negative.
Exercise Repeat Exercise but set
Exercise Modify your code from Exercise to turn it into an interactive that allows the user to vary the value of from to Use ymin and ymax options in the plot function to fix the bounds for the axis so that does not change when you change the value of
Step by Step Solution
There are 3 Steps involved in it
Step: 1

Get Instant Access to Expert-Tailored Solutions
See step-by-step solutions with expert insights and AI powered tools for academic success
Step: 2

Step: 3
Ace Your Homework with AI
Get the answers you need in no time with our AI-driven, step-by-step assistance
Get Started
Data Access Patterns Database Interactions In Object Oriented Applications
Authors: Clifton Nock
1st Edition
0321555627, 978-0321555625