Answered step by step
Verified Expert Solution
Question
1 Approved Answer
Exercise 12-30 Performance Report; Hotel (LO 12-3) The following data pertain to the Waikiki Sands Hotel for the month of March. Flexible Budget March (in
Exercise 12-30 Performance Report; Hotel (LO 12-3)
The following data pertain to the Waikiki Sands Hotel for the month of March.
Flexible Budget March (in thousands)* | Actual Results March (in thousands)* | |||||||||||
Banquets and Catering | $ | 710 | $ | 730 | ||||||||
Restaurants | 1,920 | 1,902 | ||||||||||
Kitchen staff wages | (109 | ) | (110 | ) | ||||||||
Food | (750 | ) | (762 | ) | ||||||||
Paper products | (161 | ) | (158 | ) | ||||||||
Variable overhead | (99 | ) | (102 | ) | ||||||||
Fixed overhead | (114 | ) | (129 | ) | ||||||||
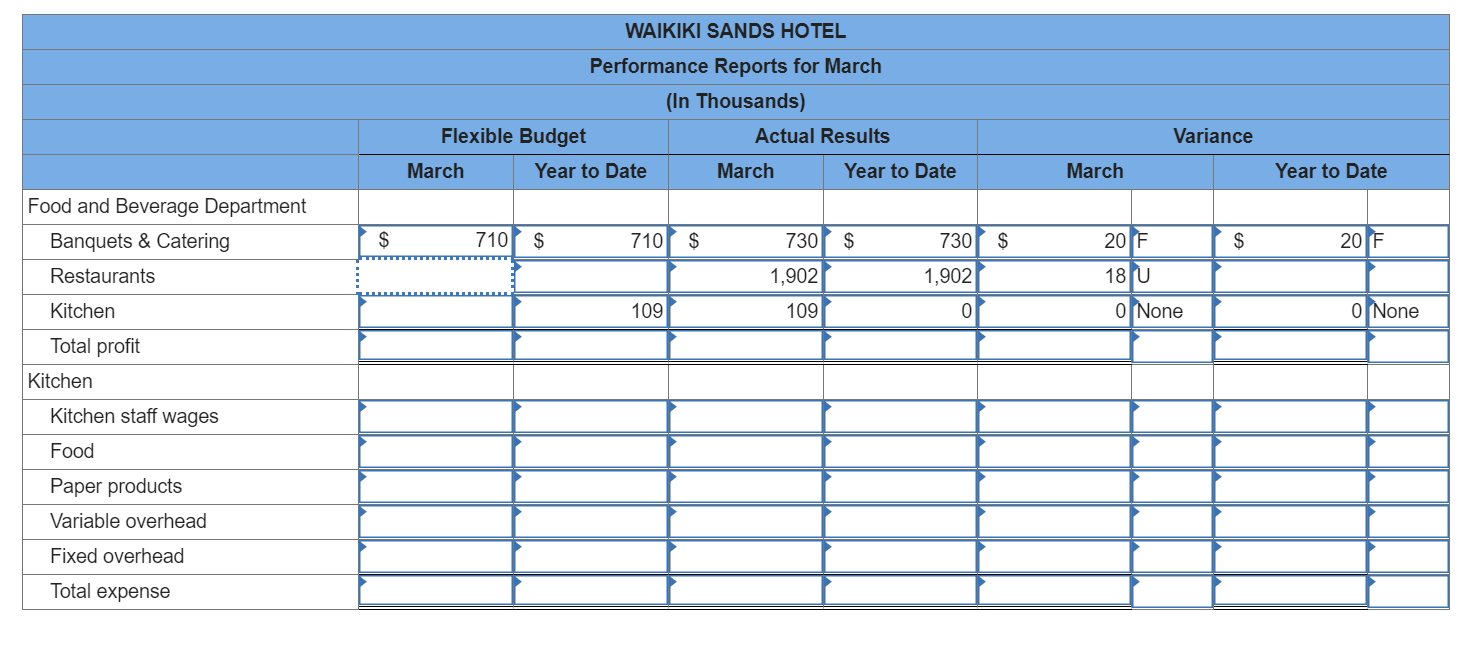
*Numbers without parentheses denote profit; numbers with parentheses denote expenses. Required: Based on Exhibit 12-4, prepare a March performance report and use the same data for year-to-date columns in your report. (Indicate the effect of each variance by selecting "F" for favorable, "U" for unfavorable. Select "None" and enter "0" for no effect (i.e., zero variance). Enter your answers in thousands.)
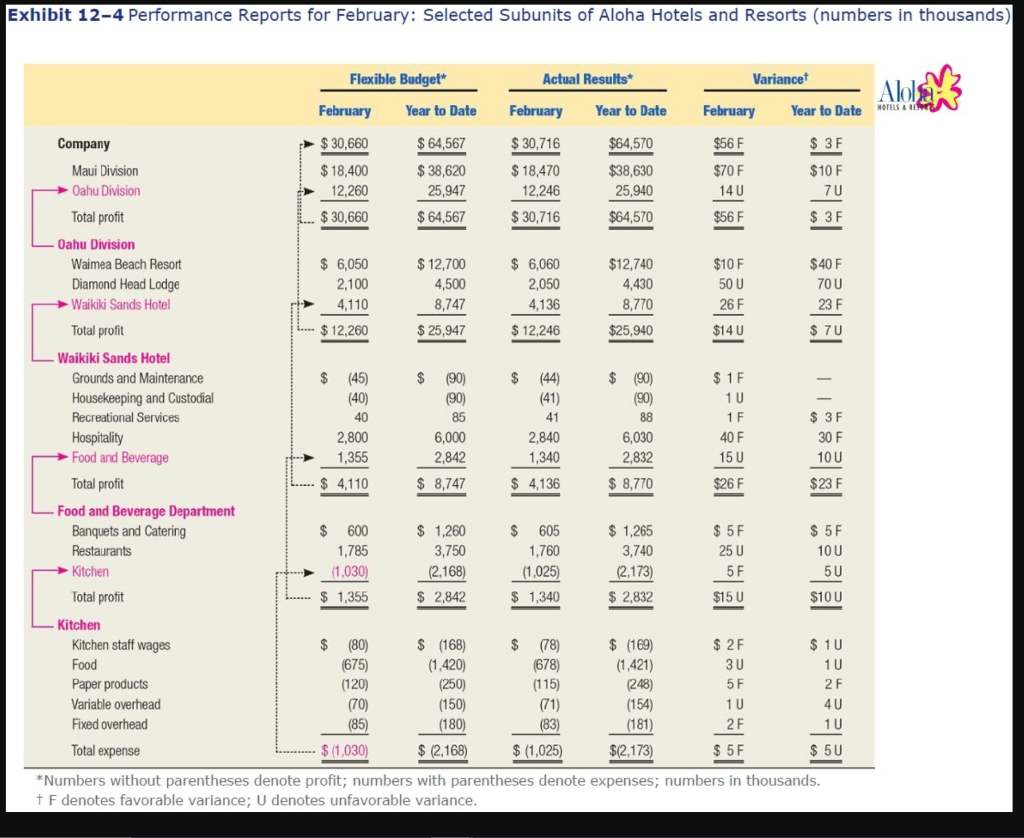
Exhibit 12-4 Performance Reports for February: Selected Subunits of Aloha Hotels and Resorts (numbers in thousands) Flexible Budget Actual Results Variancet Alole February Year to Date February Year to Date February Year to Date HOTELS & $ 30,660 $ 64,567 $ 30,716 $64,570 $56 F Company Maui Division Oahu Division $ 18,400 12,260 $ 38,620 25,947 $ 18,470 12,246 $38,630 25,940 $70 F 14U $ 3F $10 F 7U $ 3F Total profit $ 30,660 $ 64,567 $ 30,716 $64,570 $56 F $ 6,050 2,100 4,110 $ 12,700 4,500 8,747 $ 6,060 2,050 4,136 $12,740 4,430 8,770 $10 F 50 U 26 F $14U $40 F 70 U 23 F $ 7U $ 12,260 $ 25,947 $ 12,246 $25,940 $ $ Oahu Division Waimea Beach Resort Diamond Head Lodge Waikiki Sands Hotel Total profit Waikiki Sands Hotel Grounds and Maintenance Housekeeping and Custodial Recreational Services Hospitality Food and Beverage Total profit Food and Beverage Department Banquets and Catering Restaurants Kitchen Total profit (45) (40) 40 2,800 1,355 $ (90) (90) 85 6,000 2,842 $ 8,747 (44) (41) 41 2,840 1,340 $ (90) (90) 88 6,030 2,832 $ 1F 1 U 1 F 40 F 15 U $ 3F 30 F 10U $ 4,110 $ 4,136 $ 8,770 $26 F $23 F $ 600 1,785 11.030 $ 1,260 3,750 (2,168) $ 605 1,760 (1,025) $ 1,265 3,740 $ 5F 25 U 5F $ 5F 10U 5U (2,173) .......$ 1,355 $ 2,842 $ 1,340 $ 2,832 $15 U $10U $ (169) Kitchen Kitchen staff wages Food Paper products Variable overhead Fixed overhead $ (80) (675) (120) (70) (85) $ 1,030) $ (168) (1,420) (250) (150) (180) $ (2.168) $ (78) (678) (115) (71) (83) (1.421) (248) (154) $ 2F 30 5F 1 U 2F $ 5F $ 10 1 U 2 F 4U 1U $ 5U (181) Total expense $ (1,025) $(2,173) *Numbers without parentheses denote profit; numbers with parentheses denote expenses; numbers in thousands. + F denotes favorable variance; U denotes unfavorable variance. WAIKIKI SANDS HOTEL Performance Reports for March (In Thousands) Flexible Budget Actual Results March Year to Date March Year to Date Variance March Year to Date Food and Beverage Department Banquets & Catering Restaurants $ 710 $ 710 $ $ 730 $ 20 F $ 20 F 730 1,902 109 1,902 18U Kitchen 109 0 O None O None Total profit Kitchen Kitchen staff wages Food Paper products Variable overhead Fixed overhead Total expense
Step by Step Solution
There are 3 Steps involved in it
Step: 1
Get Instant Access to Expert-Tailored Solutions
See step-by-step solutions with expert insights and AI powered tools for academic success
Step: 2
Step: 3
Ace Your Homework with AI
Get the answers you need in no time with our AI-driven, step-by-step assistance
Get Started