

Answered step by step
Verified Expert Solution
Question
1 Approved Answer
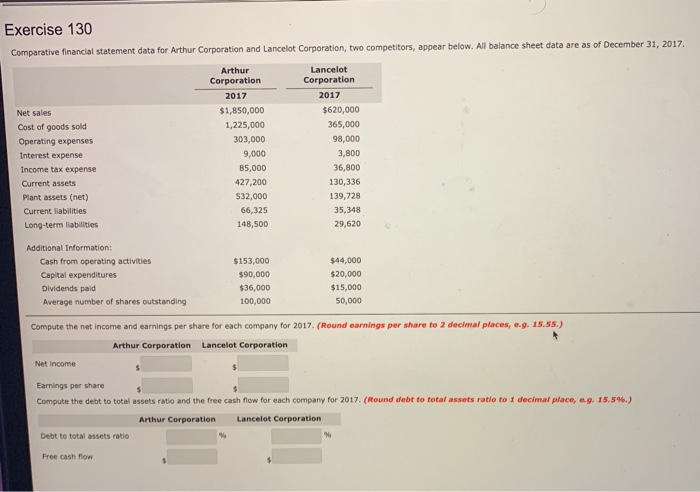
Exercise 130 Comparative financial statement data for Arthur Corporation and Lancelot Corporation, two competitors, appear below. All balance sheet data are as of December 31,
Step by Step Solution
There are 3 Steps involved in it
Step: 1

Get Instant Access to Expert-Tailored Solutions
See step-by-step solutions with expert insights and AI powered tools for academic success
Step: 2

Step: 3
Ace Your Homework with AI
Get the answers you need in no time with our AI-driven, step-by-step assistance
Get Started
Guide To Conducting Internal Audits Of Your Management Systems
Authors: Martin Pykett
1st Edition
B099C3GPMH, 979-8538997749