Answered step by step
Verified Expert Solution
Link Copied!

Question

1 Approved Answer

Exercise 13-3 Computing and interpreting trend percents LO P1 Sales Cost of goods sold Accounts receivable 2019 2018 2017 2016 2015 $ 718,080 $ 478,
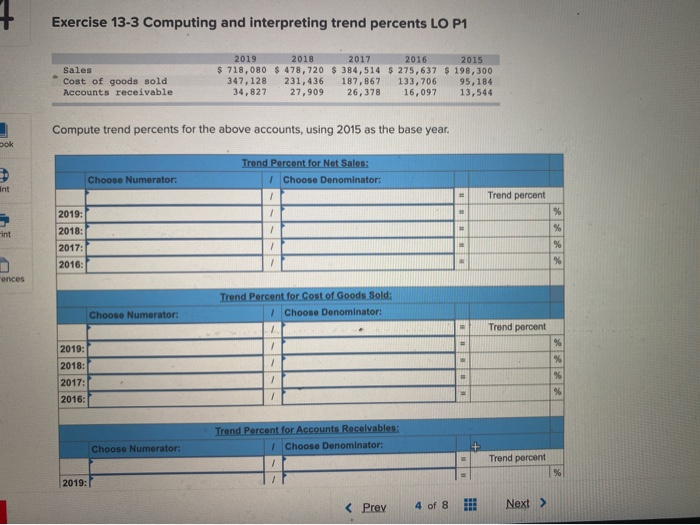
image text in transcribed
Exercise 13-3 Computing and interpreting trend percents LO P1 Sales Cost of goods sold Accounts receivable 2019 2018 2017 2016 2015 $ 718,080 $ 478, 720 $ 384,514 $ 275,637 $ 198,300 347,128 231,436 187,867 133,706 95,184 34,827 27,909 26,378 16,097 13,544 Compute trend percents for the above accounts, using 2015 as the base year. Dok Trend Percent for Net Sales: Choose Denominator: Choose Numerator: int Trend percent % 1 1 % int 2019: 2018: 2017: 2016: % % onces Trend Percent for Cost of Goods Sold: 1 Choose Denominator Choose Numerator: Trend percent 2019: 1 % % 1 2018: 2017: 2016: 1 % 1 % Trend Percent for Accounts Recevables: 1 Choose Denominator: Choose Numerator: Trend percent % 2019:

Step by Step Solution

There are 3 Steps involved in it

Step: 1

blur-text-image

Get Instant Access to Expert-Tailored Solutions

See step-by-step solutions with expert insights and AI powered tools for academic success

Step: 2

blur-text-image

Step: 3

blur-text-image

Ace Your Homework with AI

Get the answers you need in no time with our AI-driven, step-by-step assistance

Get Started

Recommended Textbook for

Internal Audit Handbook Management With The SAP Audit Roadmap

Authors: Henning Kagermann, William Kinney, Karlheinz Küting, Claus-Peter Weber, Z. Keil, C. Boecker, J. Busch, O. Bussiek, M. H. Christ, P. Eckes, M. Falk, P. S. Greenberg, B. Reichert, M. Wolf

2008th Edition

3642430392, 978-3642430398

More Books

Students also viewed these Accounting questions