Answered step by step
Verified Expert Solution
Link Copied!

Question

1 Approved Answer

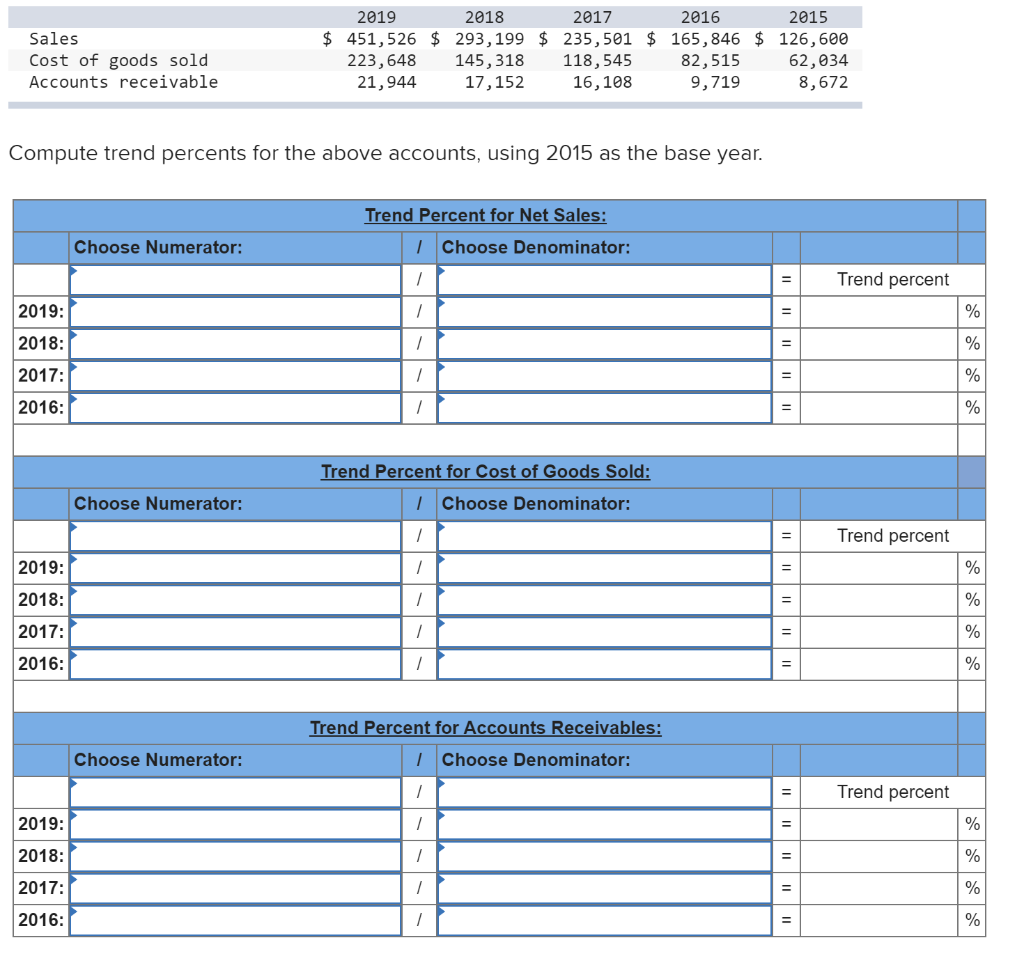
Exercise 13-3 Computing and interpreting trend percents LO P1 Sales Cost of goods sold Accounts receivable 2019 2018 2017 2016 2015 $ 451,526 $ 293,199

Exercise 13-3 Computing and interpreting trend percents LO P1

image text in transcribed

Sales Cost of goods sold Accounts receivable 2019 2018 2017 2016 2015 $ 451,526 $ 293,199 $ 235,501 $ 165,846 $ 126,600 223,648 145, 318 118,545 82,515 62,034 21,944 17, 152 16, 108 9,719 8,672 Compute trend percents for the above accounts, using 2015 as the base year. Trend Percent for Net Sales: 1 Choose Denominator: Choose Numerator: Trend percent 2019: % 2018: % 2017: % 2016: % Trend Percent for Cost of Goods Sold: I Choose Denominator: Choose Numerator: / Trend percent 2019: - % 2018: - % 2017: - % / / 2016: % Trend Percent for Accounts Receivables: Choose Denominator: Choose Numerator: = Trend percent 2019: % 2018: / % 2017: % 2016: %

Step by Step Solution

There are 3 Steps involved in it

Step: 1

blur-text-image

Get Instant Access to Expert-Tailored Solutions

See step-by-step solutions with expert insights and AI powered tools for academic success

Step: 2

blur-text-image

Step: 3

blur-text-image

Ace Your Homework with AI

Get the answers you need in no time with our AI-driven, step-by-step assistance

Get Started

Recommended Textbook for

Working Papers Volume 1 For Needles/Powers/Crossons Financial And Managerial Accounting 8th

Authors: Belverd E. Needles

8th Edition

0618777237, 978-0618777235

More Books

Students also viewed these Accounting questions