Answered step by step
Verified Expert Solution
Question
1 Approved Answer
Exercise 13-7 Liquidity analysis LO P3 Simon Company's year-end balance sheets follow. At December 31 2017 2016 2015 Assets $ 27,895 $ 31,974 $ 32,000
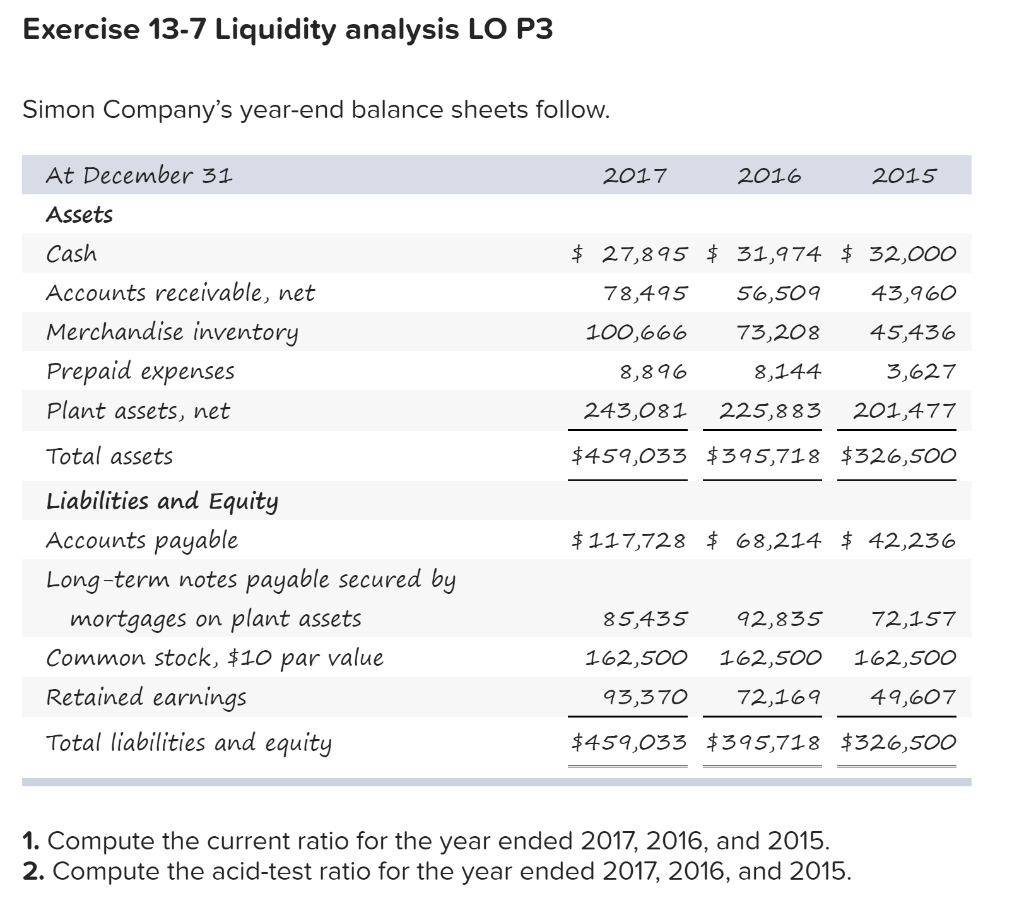
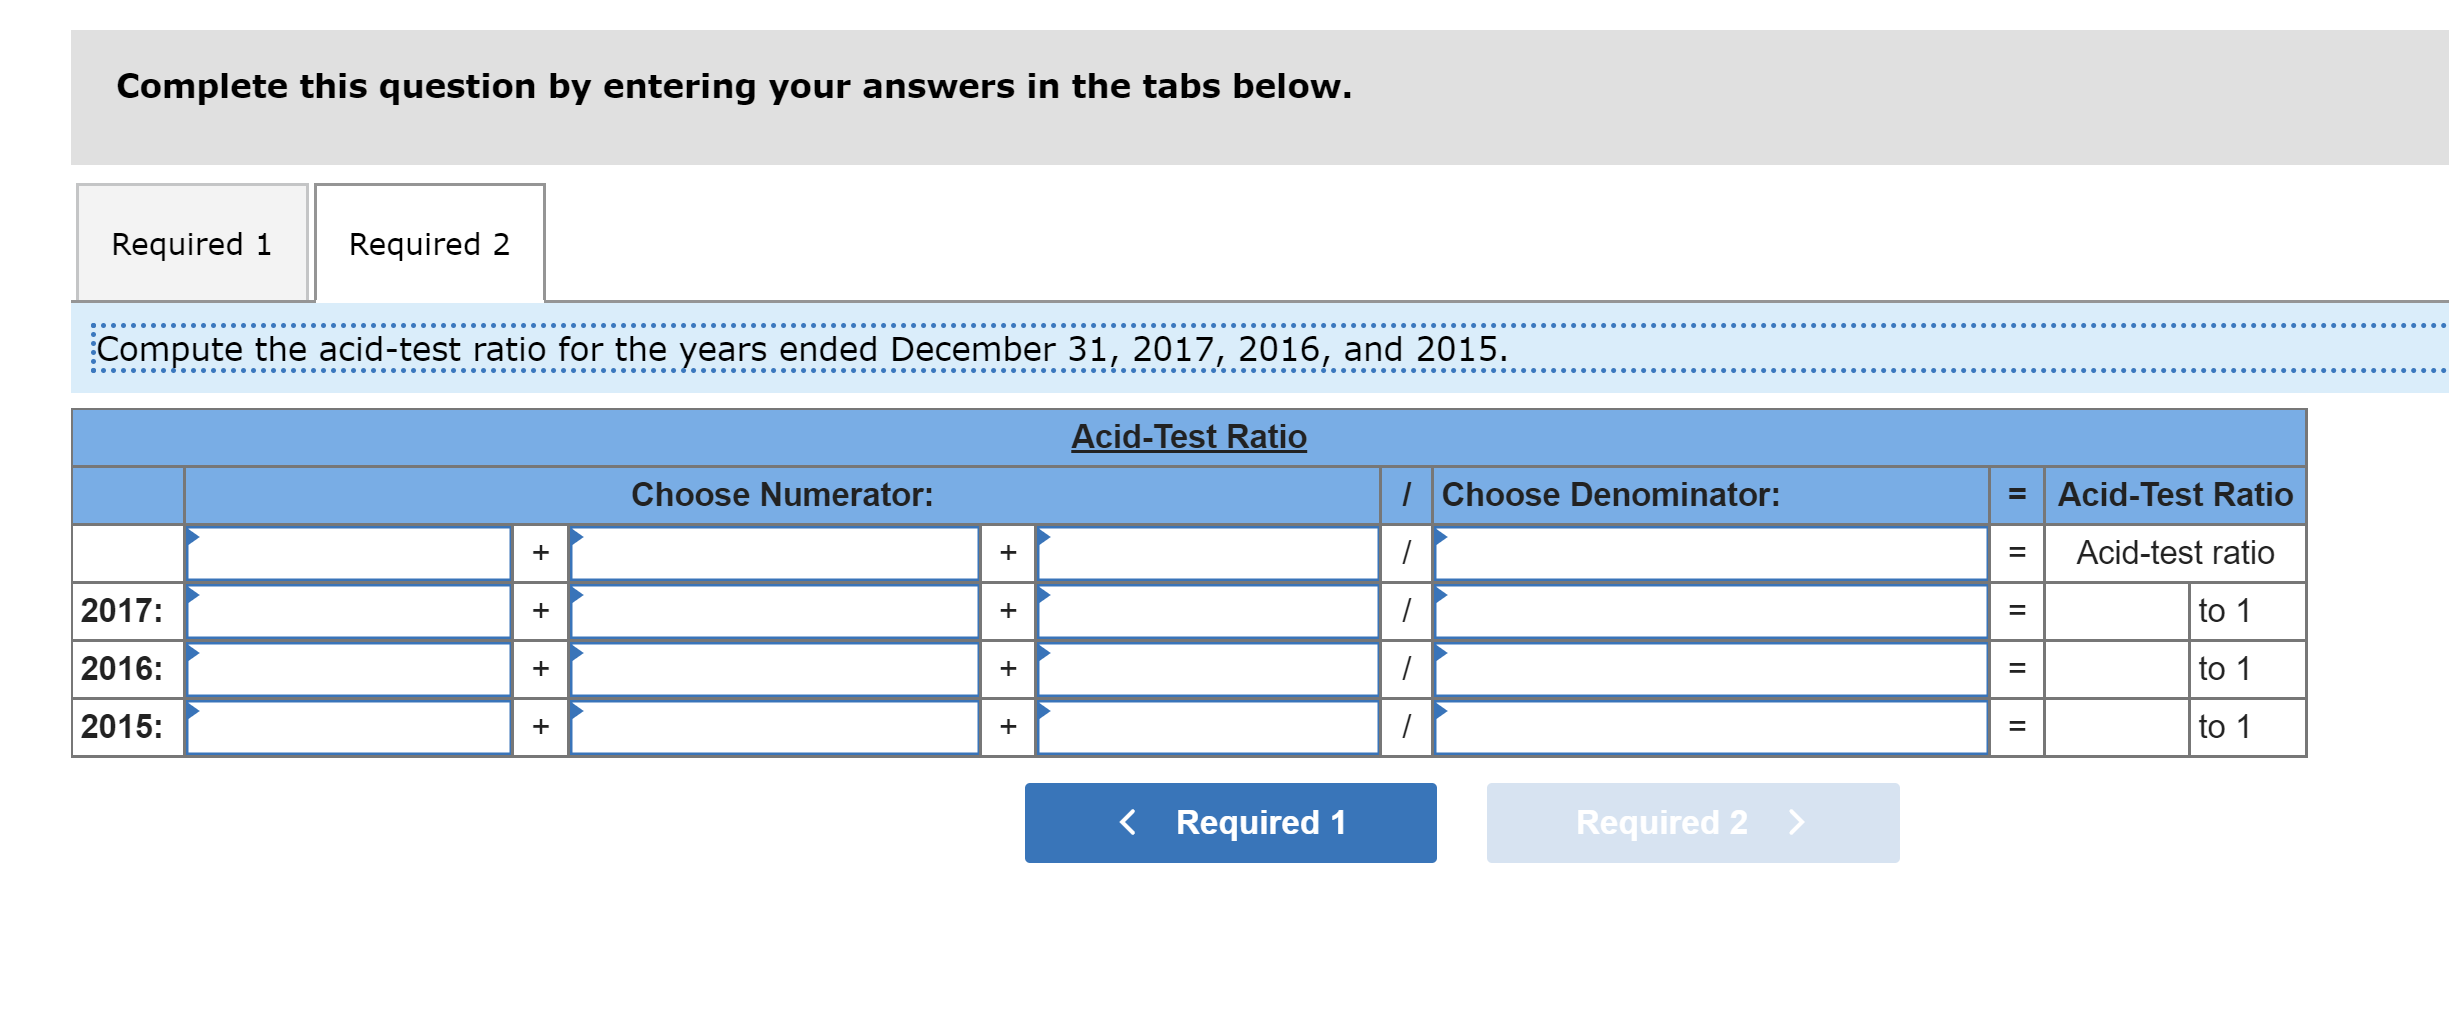
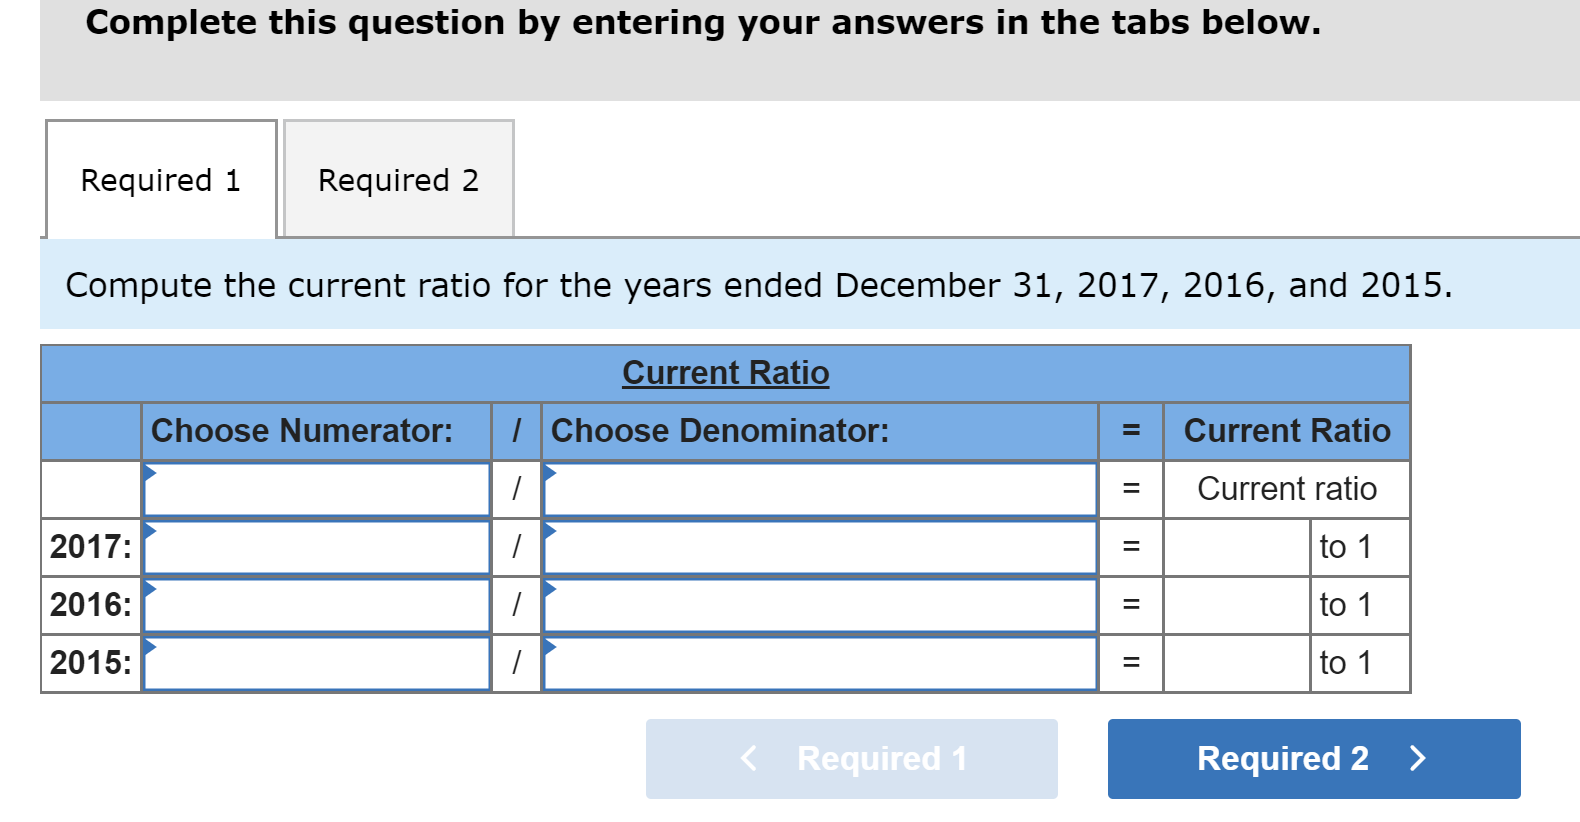
Exercise 13-7 Liquidity analysis LO P3 Simon Company's year-end balance sheets follow. At December 31 2017 2016 2015 Assets $ 27,895 $ 31,974 $ 32,000 78,495 56,509 43,960 ash Accounts receivable, net Merchandise inventory Prepaid expenses Plant assets, net 100,666 73,208 45,436 8,896 8,144 3,627 243,081 225,883 201,477 Total assets $459,033 $395,718 $326,500 $117,728 $ 68,214 $ 42,236 Liabilities and Equity Accounts payable Long-term notes payable secured by mortgages on plant assets Common stock, $10 par value Retained earnings Total liabilities and equity 85,435 92,835 72,157 162,500 162,500 162,500 93,370 72,169 49,607 $459,033 $395,718 $326,500 1. Compute the current ratio for the year ended 2017, 2016, and 2015. 2. Compute the acid-test ratio for the year ended 2017, 2016, and 2015. Complete this question by entering your answers in the tabs below. Required 1 Required 2 Compute the current ratio for the years ended December 31, 2017, 2016, and 2015. Current Ratio Choose Numerator: | Choose Denominator: Current Ratio = = - Current ratio 2017: - = to 1 2016: - to 1 2015: - = to 1 Complete this question by entering your answers in the tabs below. Required 1 Required 2 Compute the acid-test ratio for the years ended December 31, 2017, 2016, and 2015. Acid-Test Ratio Choose Numerator: | Choose Denominator: = Acid-Test Ratio + + - = Acid-test ratio 2017: + + - = to 1 + 2016: = + - to 1 2015: + + 1 to 1
Step by Step Solution
There are 3 Steps involved in it
Step: 1
Get Instant Access to Expert-Tailored Solutions
See step-by-step solutions with expert insights and AI powered tools for academic success
Step: 2
Step: 3
Ace Your Homework with AI
Get the answers you need in no time with our AI-driven, step-by-step assistance
Get Started