Answered step by step
Verified Expert Solution
Link Copied!

Question

1 Approved Answer

Exercise 14-1 Condensed data from the comparative statement of financial position of Pembina Inc. follow: 2018 2016 Current assets Non-current assets Current liabilities 2017 $120,000
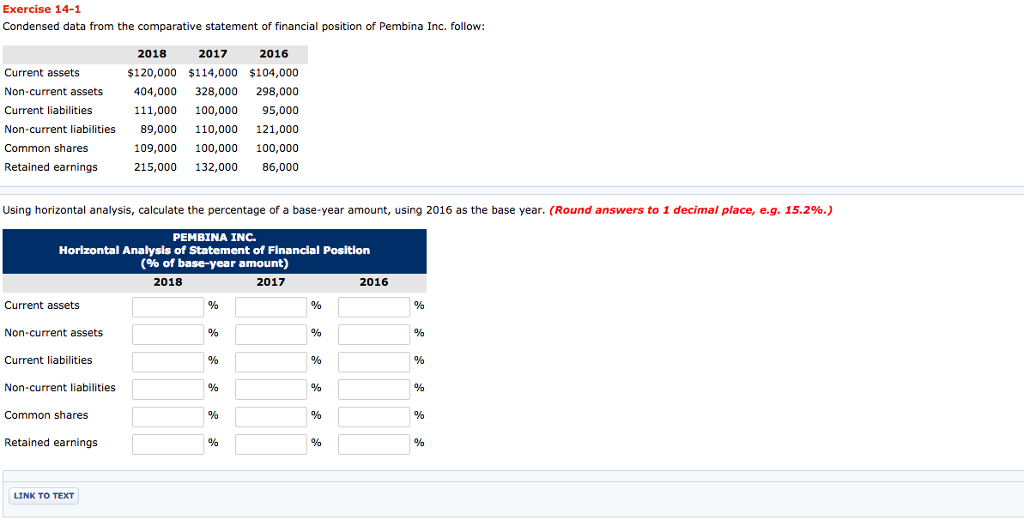
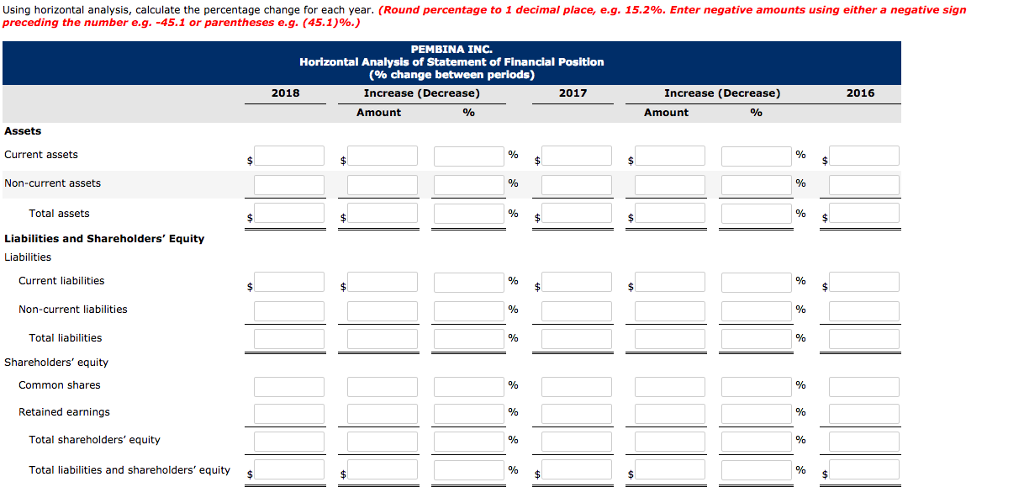
image text in transcribedimage text in transcribed

Exercise 14-1 Condensed data from the comparative statement of financial position of Pembina Inc. follow: 2018 2016 Current assets Non-current assets Current liabilities 2017 $120,000 $114,000 $104,000 404,000 328,000 298,000 111,000 100,000 95,000 Non-current liabilities 89,000 110,000 121,000 109,000 100,000 100,000 215,000 132,000 86,000 Common shares Retained earnings Using horizontal analysis, calculate the percentage of a base-year amount, using 2016 as the base year. (Round answers to 1 decimal place, eg, 15.2%.) PEMBINA INC. Horizontal Analysis of Statement of Financial Position (% of base-year amount) 2018 2017 2016 Current assets Non-current assets Current liabilities Non-current liabilities Common shares Retained earnings LINK TO TEXT

Step by Step Solution

There are 3 Steps involved in it

Step: 1

blur-text-image

Get Instant Access to Expert-Tailored Solutions

See step-by-step solutions with expert insights and AI powered tools for academic success

Step: 2

blur-text-image

Step: 3

blur-text-image

Ace Your Homework with AI

Get the answers you need in no time with our AI-driven, step-by-step assistance

Get Started

Recommended Textbook for

Advanced Level Audit And Assurance Q And A 2020

Authors: ACA Simplified

1st Edition

B08924C516, 979-8648590489

More Books

Students also viewed these Accounting questions