

Answered step by step
Verified Expert Solution
Question
1 Approved Answer
Exercise 14-3 Financial Ratios for Asset Management (L014-3) Comparative financial statements for Weller Corporation, a merchandising company, for the year ending December 31 appear below.
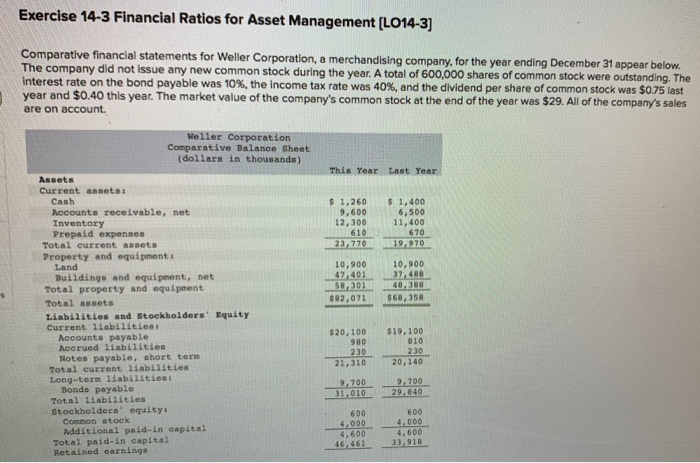
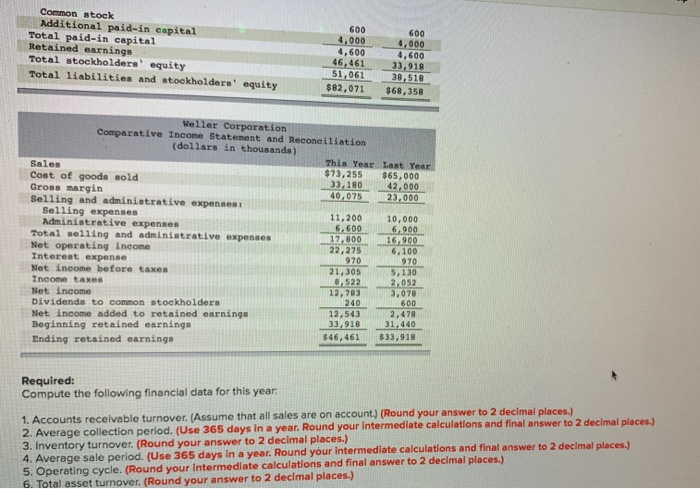 Exercise 14-3 Financial Ratios for Asset Management (L014-3) Comparative financial statements for Weller Corporation, a merchandising company, for the year ending December 31 appear below. The company did not issue any new common stock during the year. A total of 600,000 shares of common stock were outstanding. The interest rate on the bond payable was 10%, the income tax rate was 40%, and the dividend per share of common stock was $0.75 last year and $0.40 this year. The market value of the company's common stock at the end of the year was $29. All of the company's sales are on account. Weller Corporation Comparative Balance Sheet (dollars in thousands) This Year Last Year $ 1,260 9.600 12,300 1.400 6,500 11,400 610 670 23, 770 19.970 10,900 47.401 58,301 $82,071 10.900 37.488 40,388 568, 358 Assets Current assets. Cash Accounts receivable, net Inventory Prepaid expenses Total current assets Property and equipment Land Buildings and equipment, net Total property and equipment Total assets Liabilities and Stockholders' Equity Current liabilities Mocounts payable Moored liabilities Notes payable, short term Total current liabilities Long-term liabilities: Bonds payable Total liabilities Stockholders' equity Common stock Additional paid-in capital Total paid-in capital Retained earnings $20,100 230 819,100 010 2010 20,140 21,310 9,700 9,700 29,840 31.010 600 4,000 4.600 46,461 600 4,00D 4.600 1918 Common stock Additional paid-in capital Total paid-in capital Retained earnings Total stockholdersequity Total liabilities and stockholders' equity 600 4,000 4,600 46, 461 51,061 $82,071 600 4,000 4.600 33,918 38.518 $68,358 Weller Corporation Comparative Income Statement and Reconciliation (dollars in thousands) This Year Last Year Sales $73,255 $65.000 Cost of goods sold 33,180 42,000 Gross margin 40,075 Selling and administrative expenses 23,000 Selling expenses 11,200 10.000 Administrative expenses 6,600 6.900 Total selling and administrative expenses 12,800 16.900 Net operating income 22.275 6.100 Interest expense 970 970 Net income before taxes 21,305 5,130 Income taxes 8,522 2,052 Net income 12, 703 3,078 240 600 Dividends to common stockholders 12,543 2,478 Net income added to retained earnings 33,918 31,440 Beginning retained earnings $46, 461 $33,918 Ending retained earnings Required: Compute the following financial data for this year. 1. Accounts receivable turnover. (Assume that all sales are on account. (Round your answer to 2 decimal places. 2. Average collection period. (Use 365 days in a year, Round your intermediate calculations and final answer to 2 decimal places.) 3. Inventory turnover (Round your answer to 2 decimal places.) 4. Average sale period. (Use 365 days in a year. Round your intermediate calculations and final answer to 2 decimal places.) 5. Operating cycle. (Round your Intermediate calculations and final answer to 2 decimal places.) 6. Total asset turnover. (Round your answer to 2 decimal places.)
Step by Step Solution
There are 3 Steps involved in it
Step: 1

Get Instant Access to Expert-Tailored Solutions
See step-by-step solutions with expert insights and AI powered tools for academic success
Step: 2

Step: 3
Ace Your Homework with AI
Get the answers you need in no time with our AI-driven, step-by-step assistance
Get Started
Preliminary Audit Results Montanas State Employee Compensation 1990
Authors: Waters Consulting Group, Montana. State Employee Compensation Committee
1st Edition
1378152700, 978-1378152706