Answered step by step
Verified Expert Solution
Question
1 Approved Answer
Exercise 14-7 Frizell Company has the following comparative balance sheet data. FRIZELL COMPANY Balance Sheets December 31 2017 2016 Cash $15,100 29,700 Accounts receivable (net)
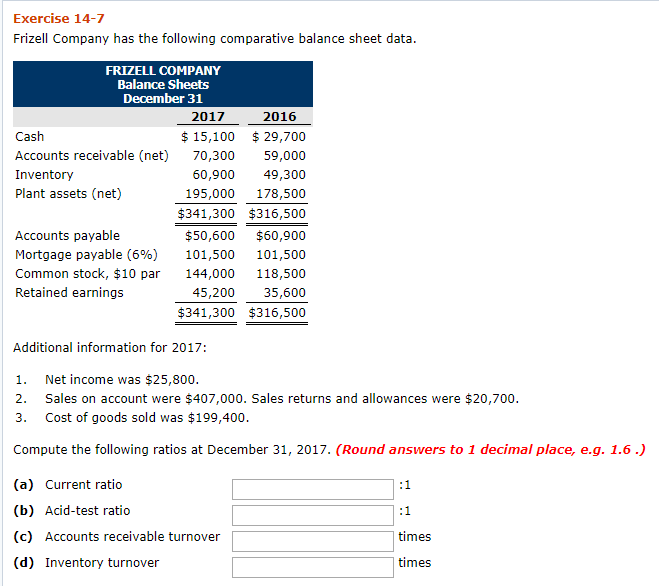
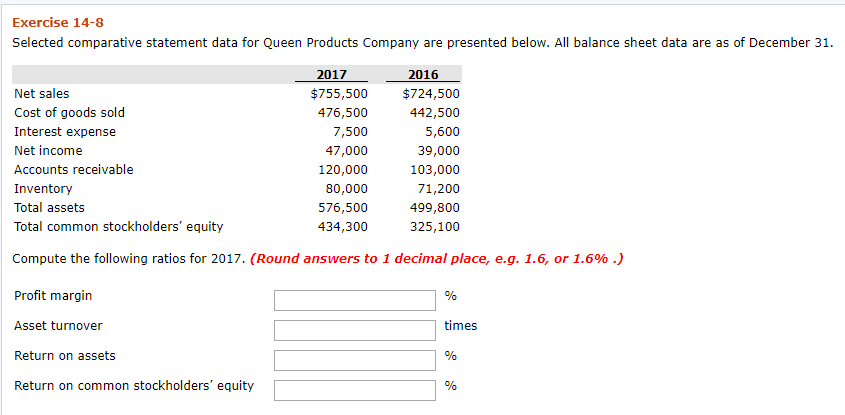
Exercise 14-7 Frizell Company has the following comparative balance sheet data. FRIZELL COMPANY Balance Sheets December 31 2017 2016 Cash $15,100 29,700 Accounts receivable (net) 70,300 59,000 Inventory 60,900 49,300 Plant assets (net) 195,000 178,500 $341,300 $316,500 Accounts payable $50,600 $60,900 Mortgage payable (6%) Common stock, $10 par 101,500 101,500 144,000 118,500 Retained earnings 45,200 35,600 $341,300 $316,500 Additional information for 2017 Net income was $25,800. 1 Sales on account were $407,000. Sales returns and allowances were $20,700. 2. Cost of goods sold was $199,400. 3. Compute the following ratios at December 31, 2017. (Round answers to 1 decimal place, e.g. 1.6 .) (a) Current ratio 1 (b) Acid-test ratio :1 (c) Accounts receivable turnover times (d) Inventory turnover times Exercise 14-8 Selected comparative statement data for Queen Products Company are presented below. All balance sheet data are as of December 31 2017 2016 Net sales $755,500 $724,500 Cost of goods sold 476,500 442,500 Interest expense 7,500 5,600 Net income 47,000 39,000 Accounts receivable 103,000 120,000 71,200 Inventory 80,000 Total assets 576,500 499,800 Total common stockholders' equity 434,300 325,100 Compute the following ratios for 2017. (Round answers to 1 decimal place, e.g. 1.6, or 1.6% .) Profit margin % times Asset turnover Return on assets % Return on common stockholders' equity %
Step by Step Solution
There are 3 Steps involved in it
Step: 1
Get Instant Access to Expert-Tailored Solutions
See step-by-step solutions with expert insights and AI powered tools for academic success
Step: 2
Step: 3
Ace Your Homework with AI
Get the answers you need in no time with our AI-driven, step-by-step assistance
Get Started