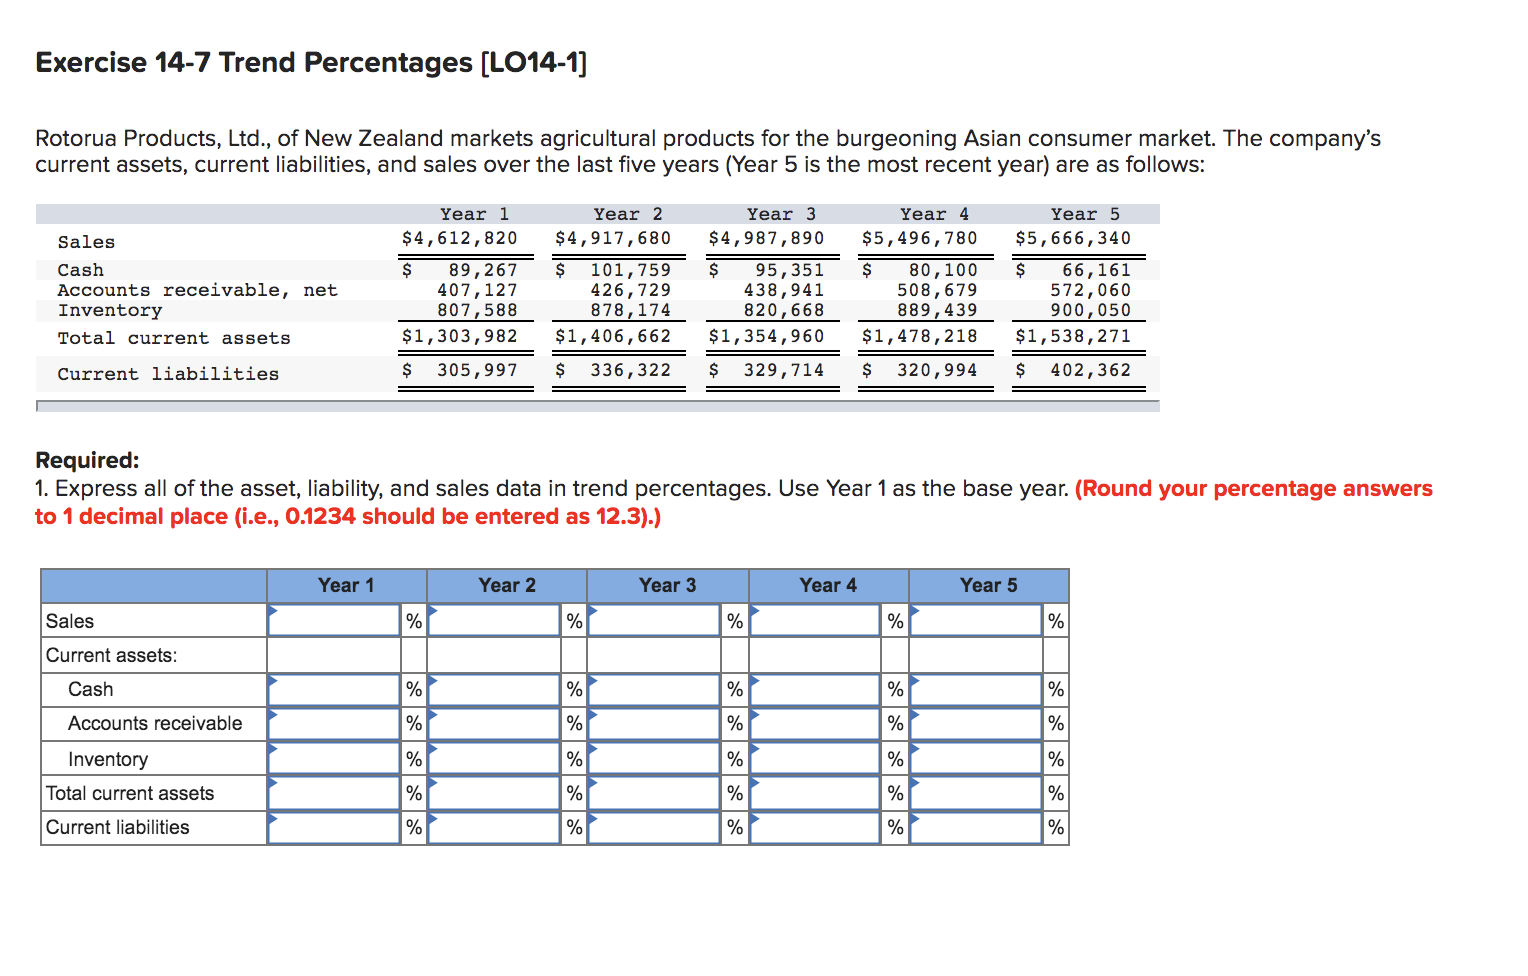
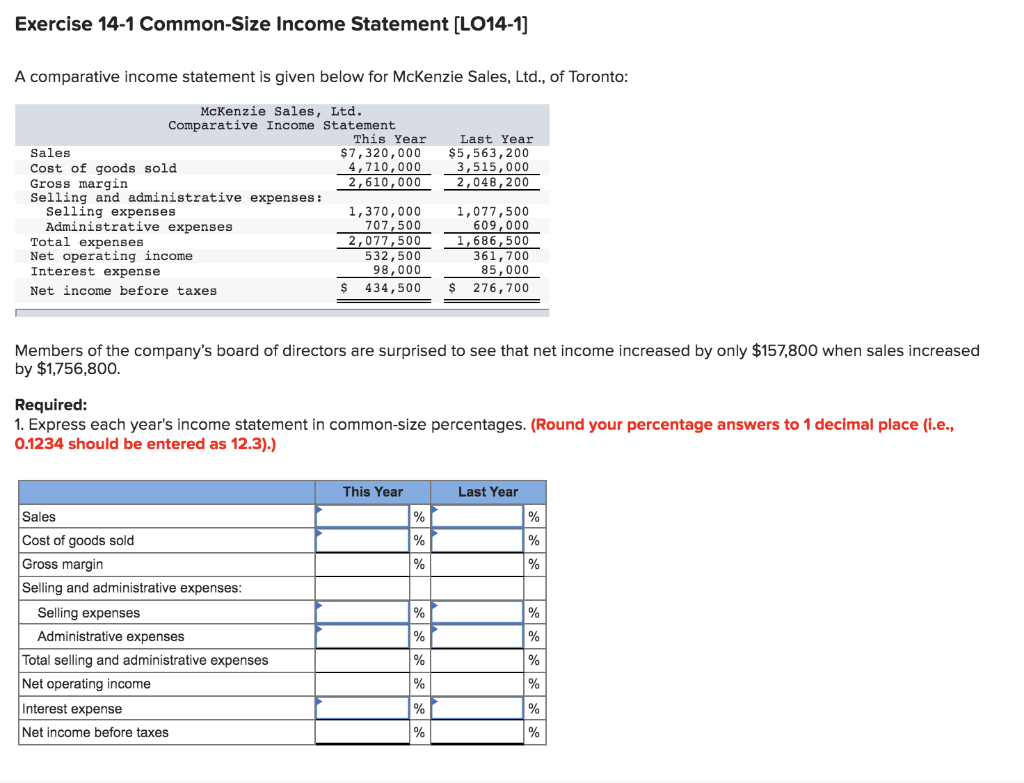
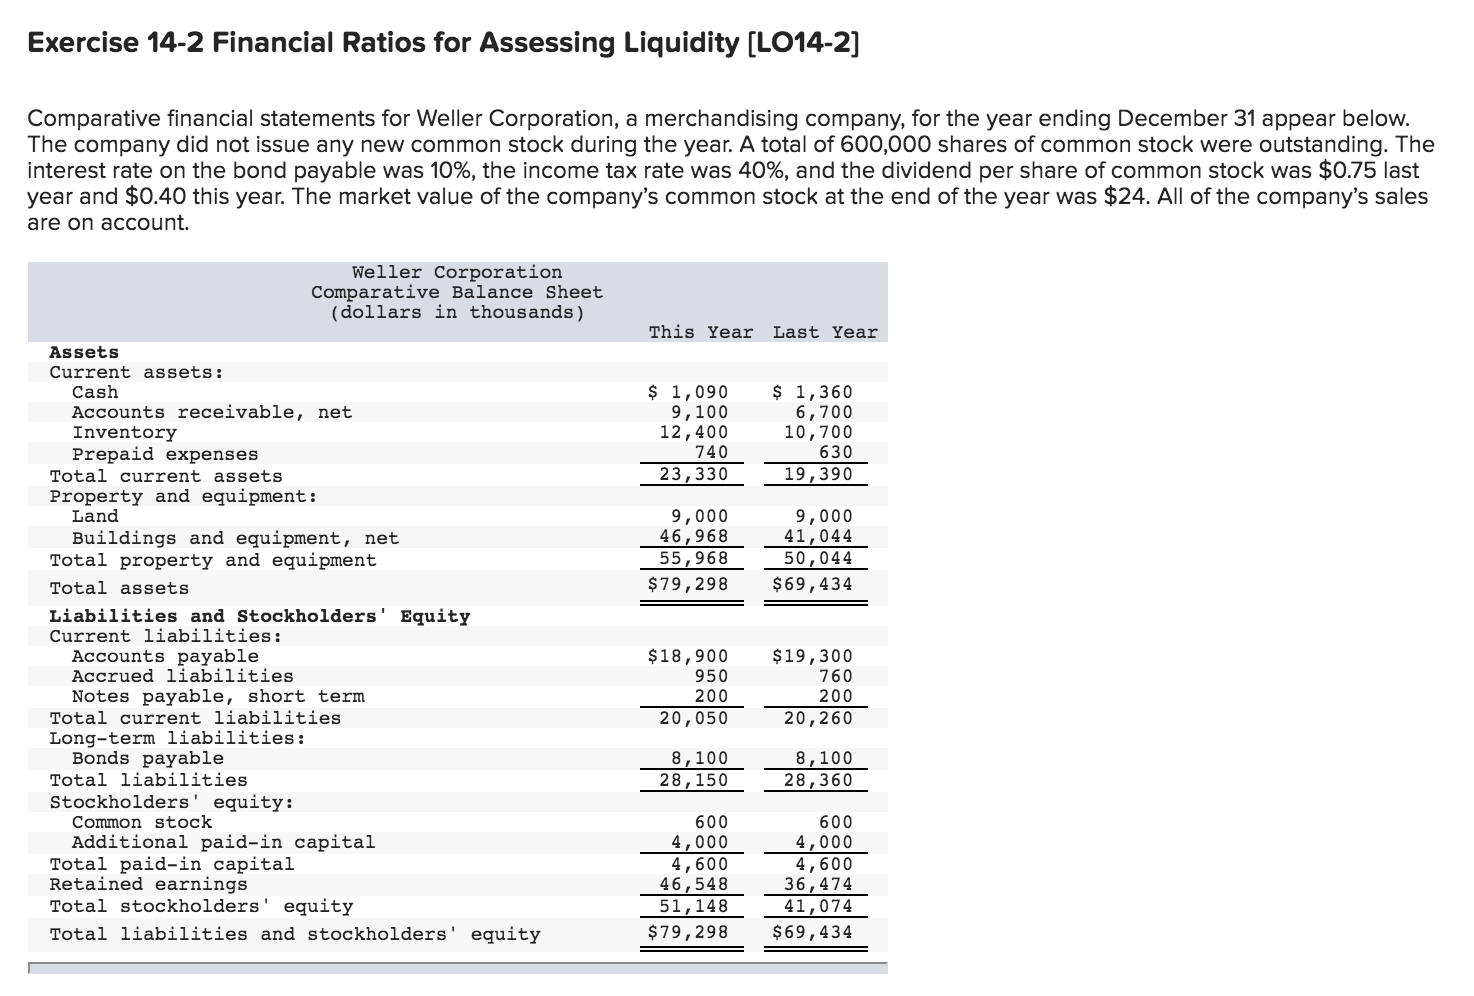
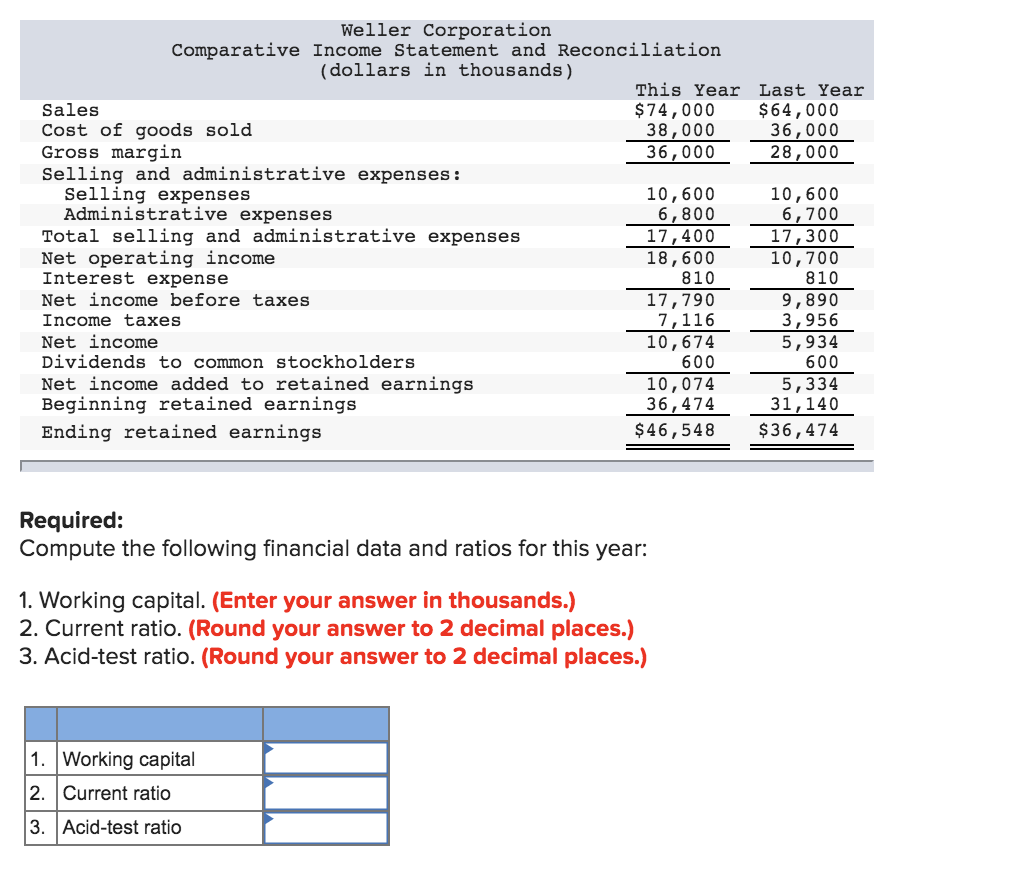
Exercise 14-7 Trend Percentages (LO14-1] Rotorua Products, Ltd., of New Zealand markets agricultural products for the burgeoning Asian consumer market. The company's current assets, current liabilities, and sales over the last five years (Year 5 is the most recent year) are as follows: Sales Cash Accounts receivable, net Inventory Total current assets Year 1 $4,612,820 $ 89,267 407,127 807,588 $1,303,982 $ 305,997 Year 2 $4,917, 680 $ 101,759 426,729 878, 174 $1,406,662 Year 3 $4,987, 890 $ 95,351 438, 941 820,668 $1,354,960 Year 4 $5,496,780 $ 80,100 508, 679 889,439 $1,478,218 $ 320,994 Year 5 $5,666,340 $ 66,161 572,060 900,050 $1,538,271 Current liabilities $ 336, 322 $ 329,714 $ 402,362 Required: 1. Express all of the asset, liability, and sales data in trend percentages. Use Year 1 as the base year. (Round your percentage answers to 1 decimal place (i.e., 0.1234 should be entered as 12.3).) Year 1 Year 2 Year 3 Year 4 Year 5 Sales % % % % % Current assets: Cash % % % % % % Accounts receivable % % % % % % % % % Inventory Total current assets % % % % % Current liabilities % % % % % Exercise 14-1 Common-Size Income Statement [LO14-1) A comparative income statement is given below for Mckenzie Sales, Ltd., of Toronto: Last Year $5,563,200 3,515,000 2,048, 200 McKenzie Sales, Ltd. Comparative Income Statement This Year Sales $7,320,000 Cost of goods sold 4,710,000 Gross margin 2,610,000 Selling and administrative expenses: Selling expenses 1,370,000 Administrative expenses 707,500 Total expenses 2,077,500 Net operating income 532,500 Interest expense 98,000 Net income before taxes S 434,500 1,077,500 609,000 1,686,500 361,700 85,000 $ 276,700 Members of the company's board of directors are surprised to see that net income increased by only $157,800 when sales increased by $1,756,800. Required: 1. Express each year's income statement in common-size percentages. (Round your percentage answers to 1 decimal place (i.e., 0.1234 should be entered as 12.3).) This Year Last Year % % % % % % % Sales Cost of goods sold Gross margin Selling and administrative expenses: Selling expenses Administrative expenses Total selling and administrative expenses Net operating income Interest expense Net income before taxes % % % % % % % % % % % Exercise 14-2 Financial Ratios for Assessing Liquidity [LO14-2] Comparative financial statements for Weller Corporation, a merchandising company, for the year ending December 31 appear below. The company did not issue any new common stock during the year. A total of 600,000 shares of common stock were outstanding. The interest rate on the bond payable was 10%, the income tax rate was 40%, and the dividend per share of common stock was $0.75 last year and $0.40 this year. The market value of the company's common stock at the end of the year was $24. All of the company's sales are on account. Weller Corporation Comparative Balance Sheet (dollars in thousands) This Year Last Year $ 1,090 9,100 12,400 740 23,330 $ 1,360 6,700 10,700 630 19,390 9,000 46,968 55,968 $ 79,298 9,000 41,044 50,044 $69, 434 Assets Current assets: Cash Accounts receivable, net Inventory Prepaid expenses Total current assets Property and equipment: Land Buildings and equipment, net Total property and equipment Total assets Liabilities and Stockholders' Equity Current liabilities: Accounts payable Accrued liabilities Notes payable, short term Total current liabilities Long-term liabilities: Bonds payable Total liabilities Stockholders' equity: Common stock Additional paid-in capital Total paid-in capital Retained earnings Total stockholders' equity Total liabilities and stockholders' equity $18,900 950 200 20,050 $19,300 760 200 20,260 8,100 28, 150 8,100 28,360 600 4,000 4,600 46,548 51, 148 $ 79,298 600 4,000 4,600 36,474 41,074 $69, 434 Last Year $64,000 36,000 28,000 Weller Corporation Comparative Income Statement and Reconciliation (dollars in thousands) This Year Sales $ 74,000 Cost of goods sold 38,000 Gross margin 36,000 Selling and administrative expenses: Selling expenses 10,600 Administrative expenses 6,800 Total selling and administrative expenses 17,400 Net operating income 18,600 Interest expense 810 Net income before taxes 17,790 Income taxes 7,116 Net income 10,674 Dividends to common stockholders 600 Net income added to retained earnings 10,074 Beginning retained earnings 36,474 Ending retained earnings $46,548 10,600 6,700 17,300 10,700 810 9,890 3,956 5,934 600 5,334 31,140 $36,474 Required: Compute the following financial data and ratios for this year: 1. Working capital. (Enter your answer in thousands.) 2. Current ratio. (Round your answer to 2 decimal places.) 3. Acid-test ratio. (Round your answer to 2 decimal places.) 1. Working capital 2. Current ratio 3. Acid-test ratio