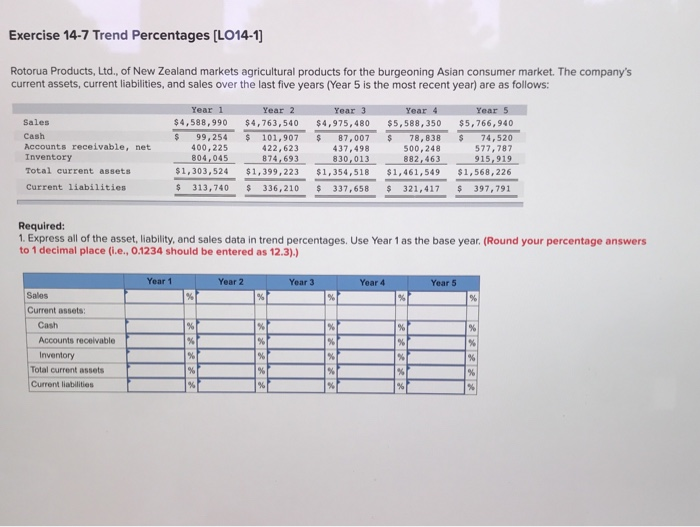
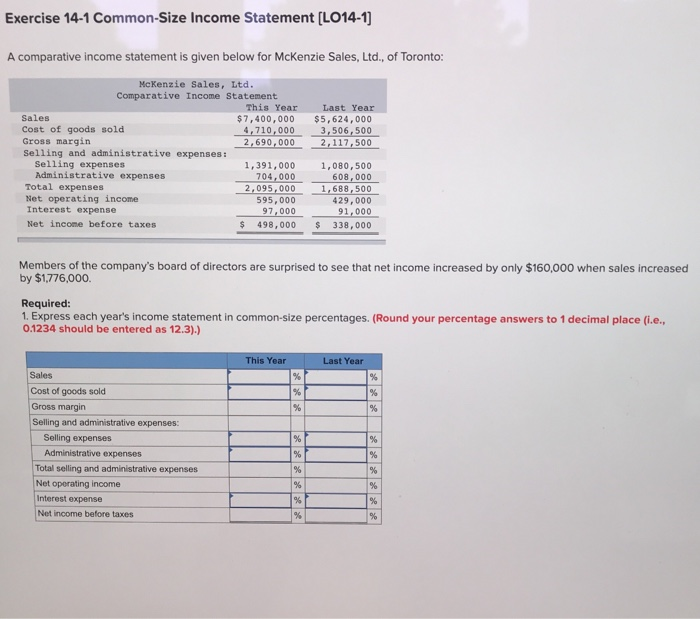
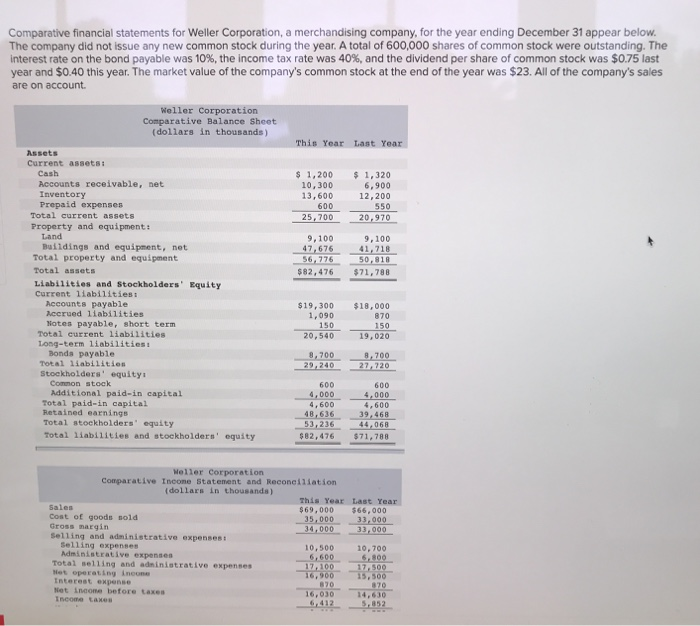
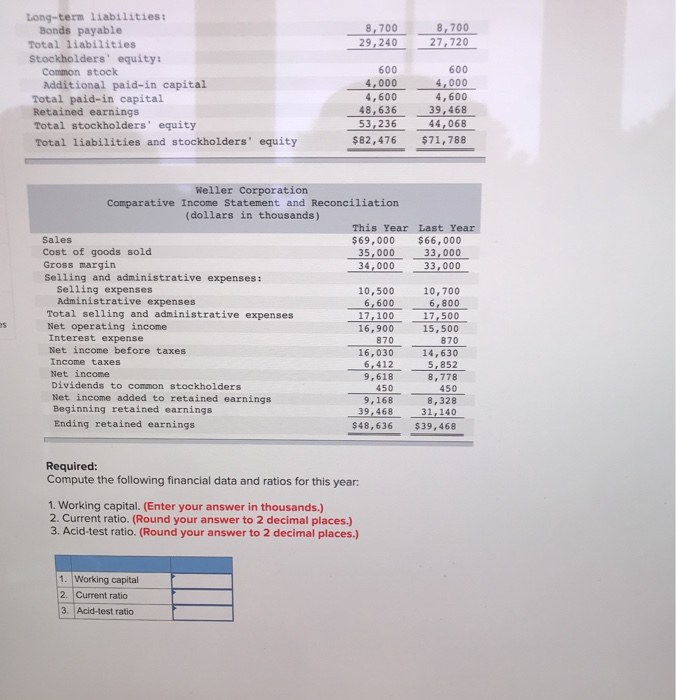
Exercise 14-7 Trend Percentages [LO14-1] Rotorua Products, Ltd., of New Zealand markets agricultural products for the burgeoning Asian consumer market. The company's current assets, current liabilities, and sales over the last five years (Year 5 is the most recent year) are as follows: $ Sales Cash Accounts receivable, net Inventory Total current assets Current liabilities Year 1 $4,588,990 $ 99,254 400,225 804,045 $1,303,524 $ 313,740 Year 2 $4,763,540 $ 101,907 422,623 874,693 $1,399,223 $ 336,210 Year 3 $4,975, 480 $ 87,007 437, 498 830,013 $1,354,518 $ 337,658 Year 4 $5,588,350 78,838 500,248 882,463 $1,461,549 $ 321, 417 Year 5 $5,766,940 $ 74,520 577,787 915, 919 $1,568,226 $ 397,791 Required: 1. Express all of the asset, liability, and sales data in trend percentages. Use Year 1 as the base year. (Round your percentage answers to 1 decimal place (i.e., 0.1234 should be entered as 12.3).) Year 1 Year 2 Year 3 Year 4 Year 5 % % % % Sales Current assets: Cash Accounts receivable Inventory Total current assets Current liabilities % % % % % % % % % % % % % % % % % % Exercise 14-1 Common-Size Income Statement [LO14-1) A comparative income statement is given below for McKenzie Sales, Ltd., of Toronto: Last Year $5,624,000 3,506,500 2,117,500 McKenzie Sales, Ltd. Comparative Income Statement This Year Sales $ 7,400,000 Cost of goods sold 4,710,000 Gross margin 2,690,000 Selling and administrative expenses : Selling expenses 1,391,000 Administrative expenses 704,000 Total expenses 2,095,000 Net operating income 595,000 Interest expense 97,000 Net income before taxes $ 498,000 1,080,500 608,000 1,688,500 429,000 91,000 338,000 $ Members of the company's board of directors are surprised to see that net income increased by only $160,000 when sales increased by $1,776,000 Required: 1. Express each year's income statement in common-size percentages. (Round your percentage answers to 1 decimal place (i.e., 0.1234 should be entered as 12.3).) This Year Last Year % % % % % % % Sales Cost of goods sold Gross margin Selling and administrative expenses: Selling expenses Administrative expenses Total selling and administrative expenses Net operating income Interest expense Net income before taxes % % % % % % % % % % Comparative financial statements for Weller Corporation, a merchandising company, for the year ending December 31 appear below. The company did not issue any new common stock during the year. A total of 600,000 shares of common stock were outstanding. The interest rate on the bond payable was 10%, the income tax rate was 40%, and the dividend per share of common stock was $0.75 last year and $0.40 this year. The market value of the company's common stock at the end of the year was $23. All of the company's sales are on account Weller Corporation Comparative Balance Sheet (dollars in thousands) This Year Last Year $ 1,200 10,300 13,600 600 25,700 $ 1,320 6,900 12,200 550 20,970 9,100 47,676 56,276 $82,476 9,100 41,718 50,810 $71,788 Assets Current assets: Cash Accounts receivable, net Inventory Prepaid expenses Total current assets Property and equipment: Land Buildings and equipment, net Total property and equipment Total assets Liabilities and Stockholders' Equity Current liabilities: Accounts payable Accrued liabilities Notes payable, short term Total current liabilities Long-term liabilities: Bonds payable Total liabilities Stockholders' equity Common stock Additional paid-in capital Total paid-in capital Retained earnings Total stockholders' equity Total liabilities and stockholders' equity $19,300 1,090 150 20.540 $18,000 870 150 19,020 8,700 29,240 8,700 27.220 600 4,000 4.600 48,636 53,236 $82,476 600 4,000 4,600 39,468 $71, 788 Meller Corporation Comparative Income Statement and Reconciliation dollars in thousands) This Year Last Year Sales $69,000 566,000 Cost of goods sold 35.000 33,000 Gross margin 34,000 33,000 Selling and administrative expenses: Selling expenses 10,500 10,700 Administrative expenses 6,600 6.800 Total selling and administrative expenses 17, 100 17.500 Het operating income 15,500 Interest expense 870 820 Net Income before taxes 16,030 14,630 Income taxe 6,412 8,700 29,240 8,700 27, 720 Long-term liabilities: Bonds payable Total liabilities Stockholders' equity: Common stock Additional paid-in capital Total paid-in capital Retained earnings Total stockholders' equity Total liabilities and stockholders' equity 600 4,000 4,600 48,636 53,236 $82, 476 600 4,000 4,600 39,468 44,068 $71,788 Weller Corporation Comparative Income Statement and Reconciliation (dollars in thousands) This Year Last Year Sales $69,000 $ 66,000 Cost of goods sold 35,000 33,000 Gross margin 34,000 33,000 Selling and administrative expenses : Selling expenses 10,500 10,700 Administrative expenses 6,600 6,800 Total selling and administrative expenses 17,100 17,500 Net operating income 16,900 15,500 Interest expense 870 870 Net income before taxes 16,030 14,630 Income taxes 6,412 5,852 Net income 9,618 8,778 Dividends to common stockholders 450 450 Net income added to retained earnings 9,168 8,328 Beginning retained earnings 39,468 31,140 Ending retained earnings $48,636 $39,468 es Required: Compute the following financial data and ratios for this year: 1. Working capital. (Enter your answer in thousands.) 2. Current ratio. (Round your answer to 2 decimal places.) 3. Acid-test ratio. (Round your answer to 2 decimal places.) 1. Working capital 2. Current ratio 3. Acid-test ratio