

Answered step by step
Verified Expert Solution
Question
1 Approved Answer
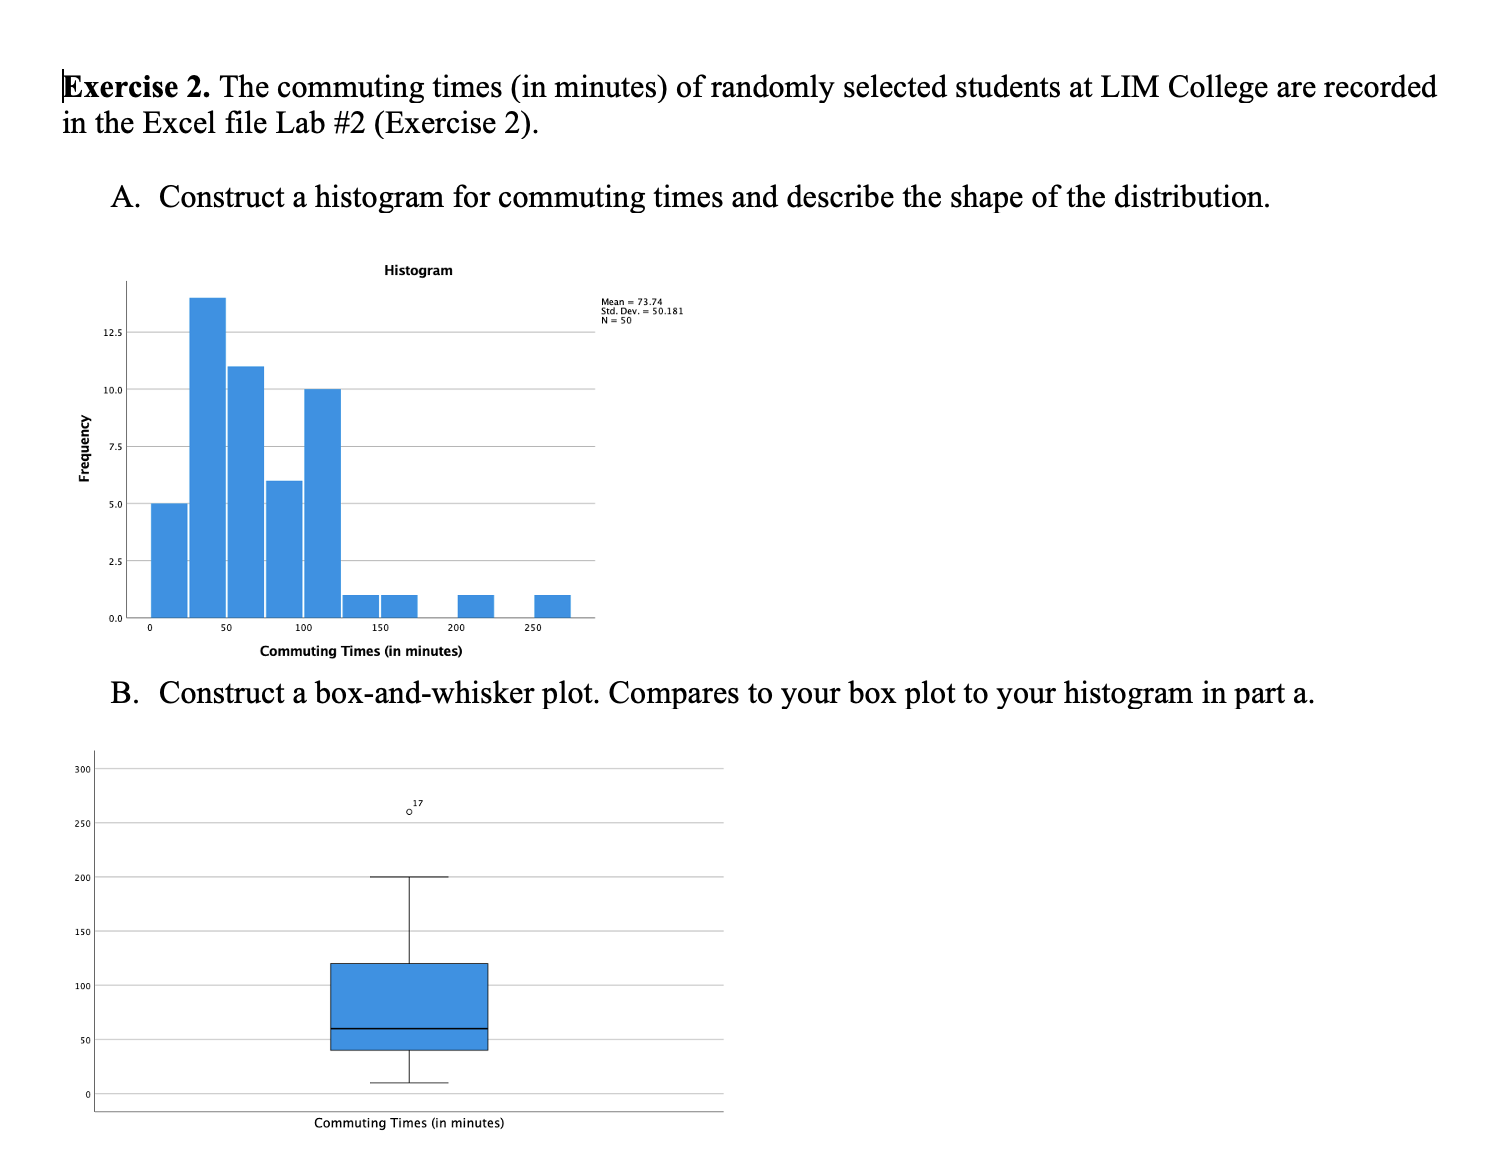
Exercise 2. The commuting times (in minutes) of randomly selected students at LIM College are recorded in the Excel file Lab #2 (Exercise 2). A.
Step by Step Solution
There are 3 Steps involved in it
Step: 1

Get Instant Access to Expert-Tailored Solutions
See step-by-step solutions with expert insights and AI powered tools for academic success
Step: 2

Step: 3
Ace Your Homework with AI
Get the answers you need in no time with our AI-driven, step-by-step assistance
Get Started