Answered step by step
Verified Expert Solution
Question
1 Approved Answer
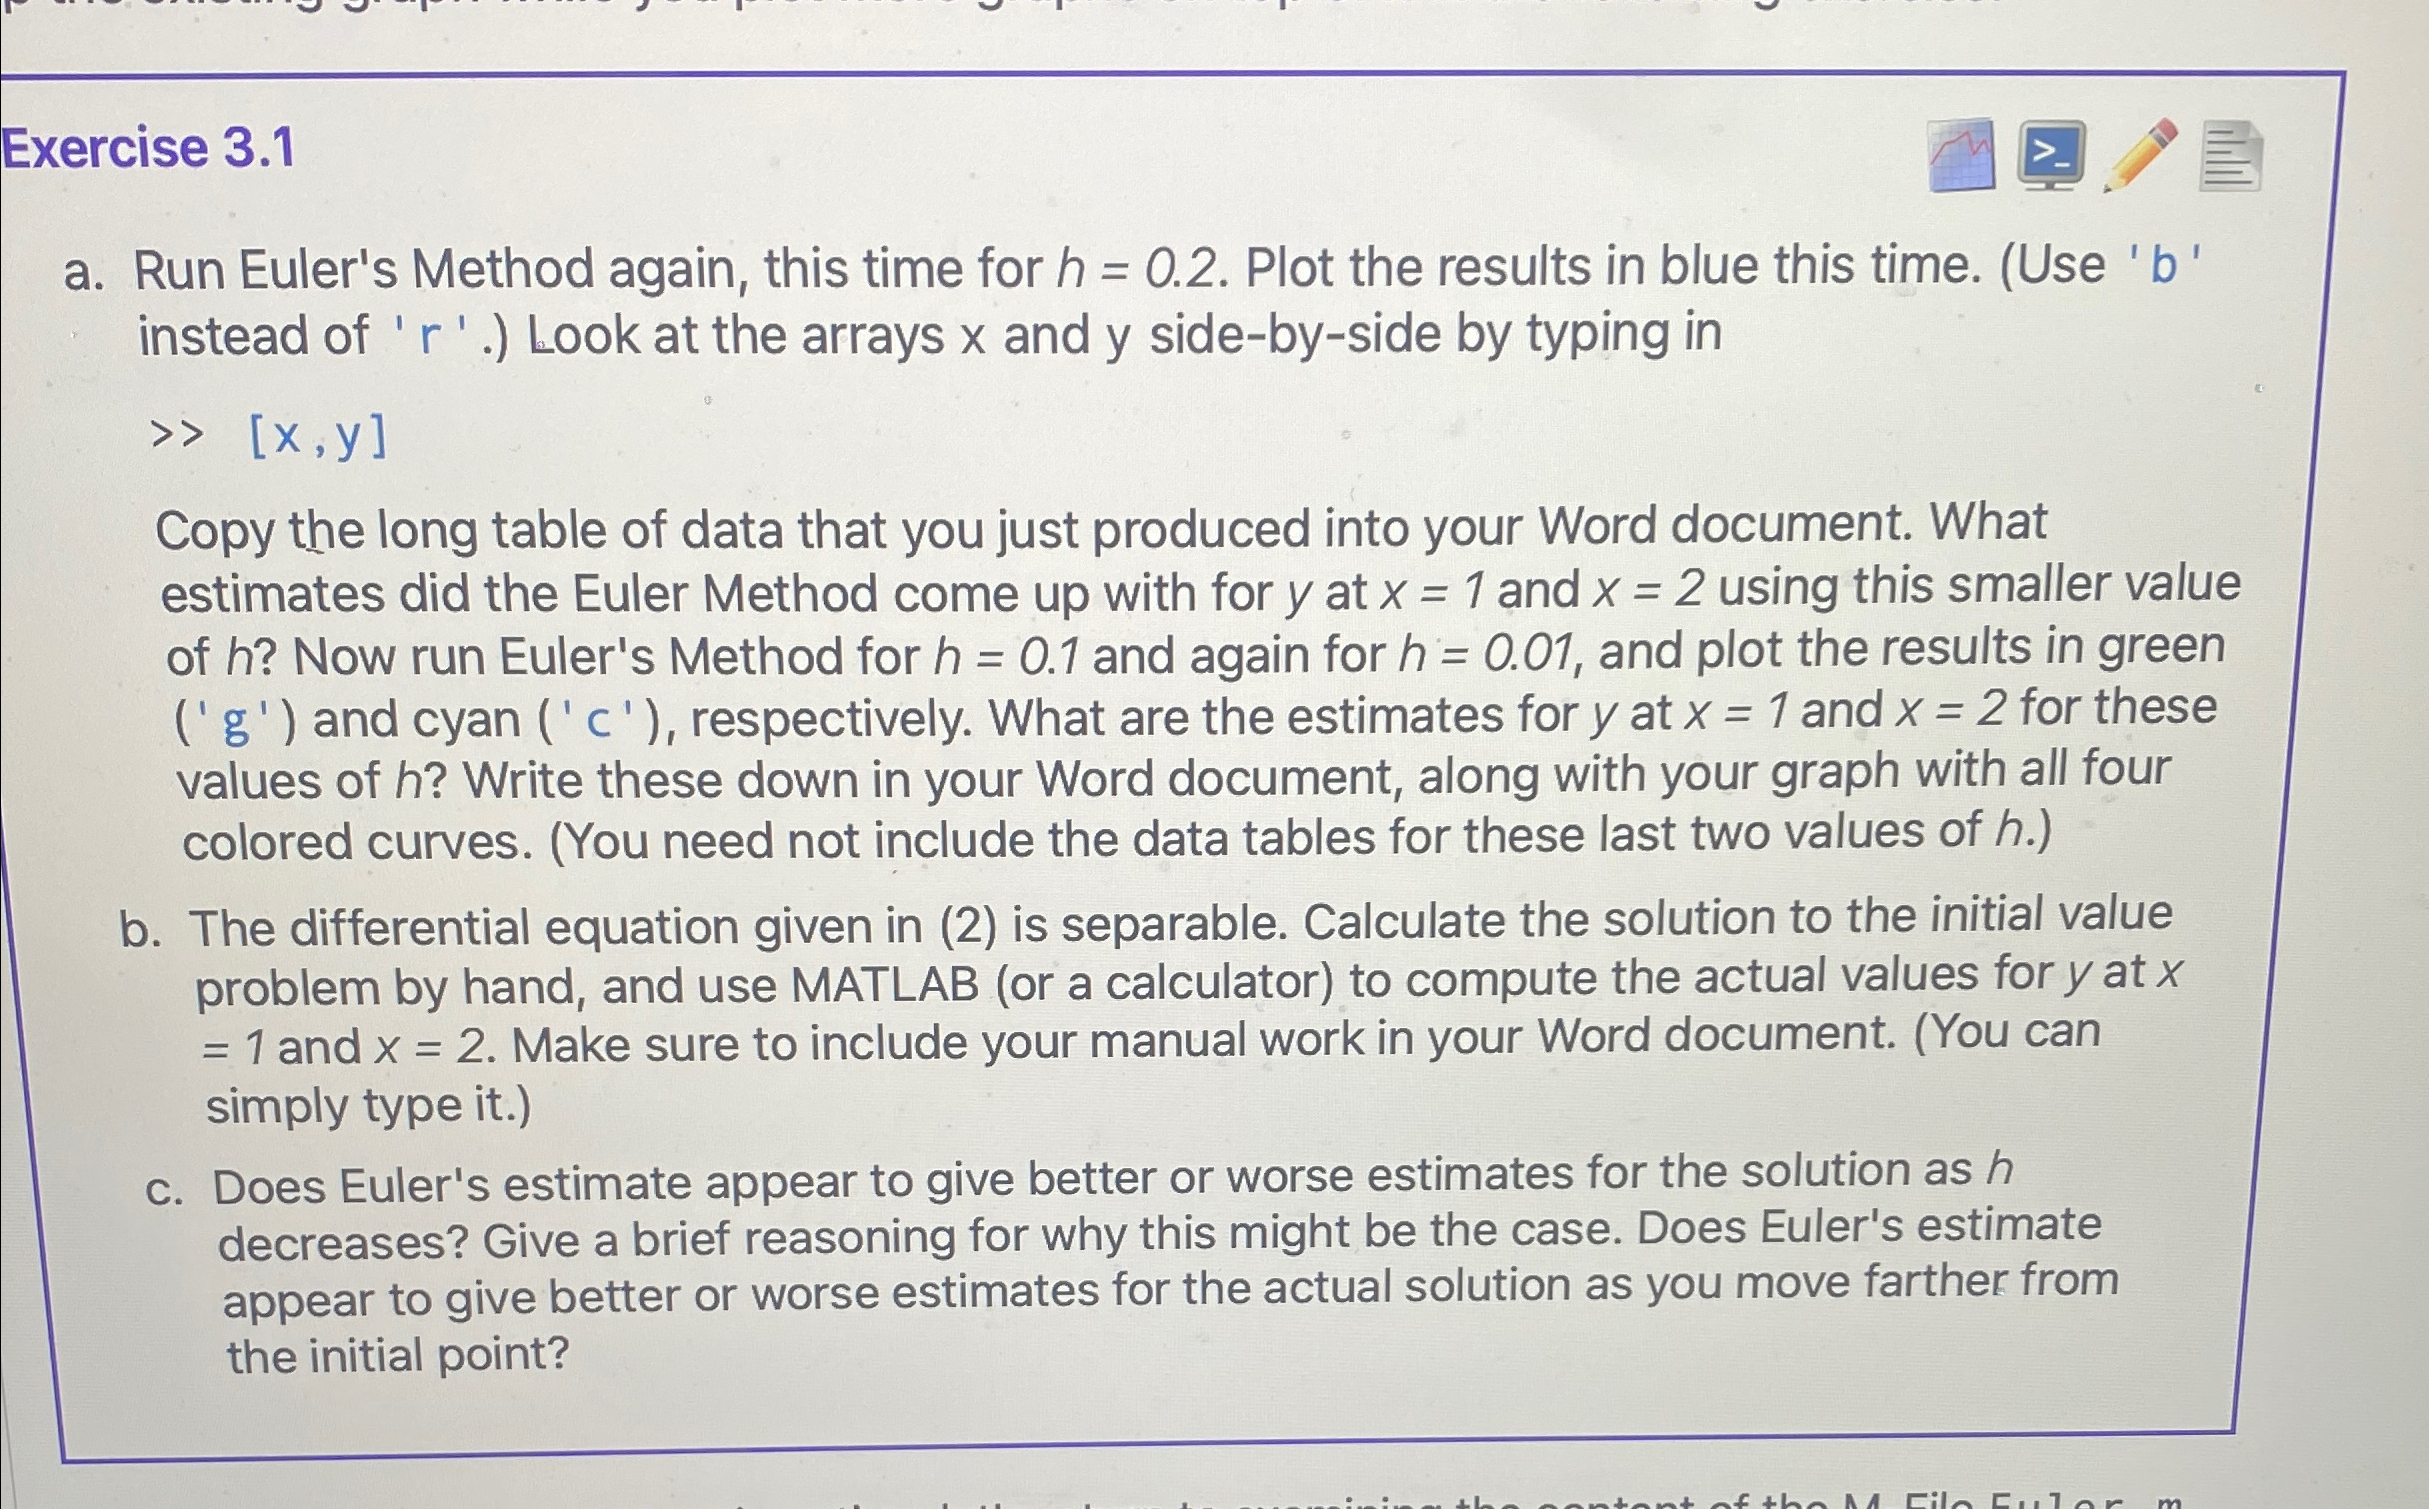
Exercise 3 . 1 a . Run Euler's Method again, this time for h = 0 . 2 . Plot the results in blue this
Exercise
a Run Euler's Method again, this time for Plot the results in blue this time. Use instead of Look at the arrays and sidebyside by typing in
Copy the long table of data that you just produced into your Word document. What estimates did the Euler Method come up with for at and using this smaller value of Now run Euler's Method for and again for and plot the results in green and cyan respectively. What are the estimates for at and for these values of Write these down in your Word document, along with your graph with all four colored curves. You need not include the data tables for these last two values of
b The differential equation given in is separable. Calculate the solution to the initial value problem by hand, and use MATLAB or a calculator to compute the actual values for at and Make sure to include your manual work in your Word document. You can simply type it
c Does Euler's estimate appear to give better or worse estimates for the solution as decreases? Give a brief reasoning for why this might be the case. Does Euler's estimate appear to give better or worse estimates for the actual solution as you move farther fRom the initial
point?
Respond in MATLAB code please!

Step by Step Solution
There are 3 Steps involved in it
Step: 1

Get Instant Access to Expert-Tailored Solutions
See step-by-step solutions with expert insights and AI powered tools for academic success
Step: 2

Step: 3

Ace Your Homework with AI
Get the answers you need in no time with our AI-driven, step-by-step assistance
Get Started


