Answered step by step
Verified Expert Solution
Link Copied!

Question

1 Approved Answer

Exercise 3. Calculation with the IS curve and the multiplier. Show how to derive an IS curve that includes the consumption multiplier. That is, assume
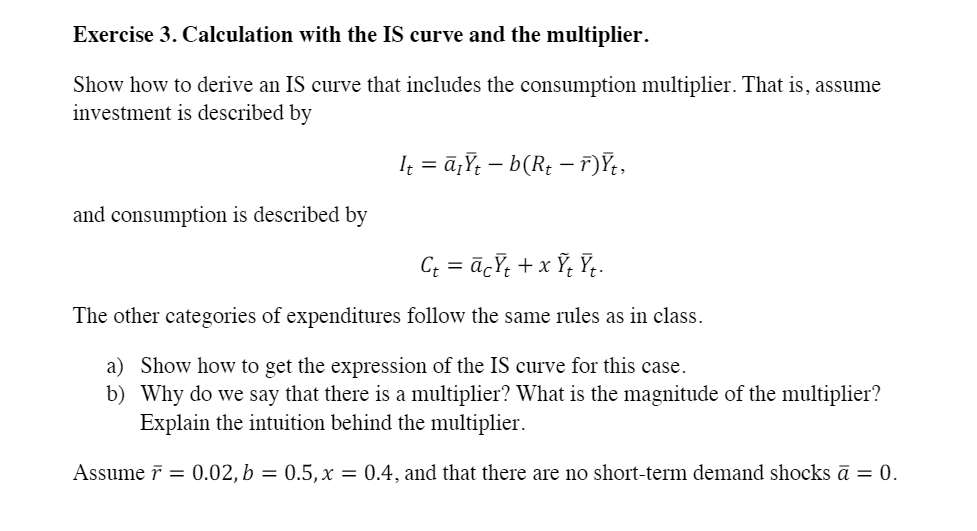
image text in transcribedimage text in transcribed

Exercise 3. Calculation with the IS curve and the multiplier. Show how to derive an IS curve that includes the consumption multiplier. That is, assume investment is described by It = ;t b(Rt 7)}t, and consumption is described by C = ac. +x 7. . The other categories of expenditures follow the same rules as in class. a) Show how to get the expression of the IS curve for this case. b) Why do we say that there is a multiplier? What is the magnitude of the multiplier? Explain the intuition behind the multiplier. Assume r = 0.02, b = 0.5, x = 0.4, and that there are no short-term demand shocks = 0. c) How does output respond when the real interest rate increases by 0.01. d) Draw a graph of the baseline IS-curve and the IS-curve with the multiplier. You should plot the short-term fluctuation (X-axis) vs the real interest rate in the (Y-axis), for each case. Which curve is flatter, and why? e) By how much does output increase if there is an aggregate demand shock that increases g by 0.01. Exercise 3. Calculation with the IS curve and the multiplier. Show how to derive an IS curve that includes the consumption multiplier. That is, assume investment is described by It = ;t b(Rt 7)}t, and consumption is described by C = ac. +x 7. . The other categories of expenditures follow the same rules as in class. a) Show how to get the expression of the IS curve for this case. b) Why do we say that there is a multiplier? What is the magnitude of the multiplier? Explain the intuition behind the multiplier. Assume r = 0.02, b = 0.5, x = 0.4, and that there are no short-term demand shocks = 0. c) How does output respond when the real interest rate increases by 0.01. d) Draw a graph of the baseline IS-curve and the IS-curve with the multiplier. You should plot the short-term fluctuation (X-axis) vs the real interest rate in the (Y-axis), for each case. Which curve is flatter, and why? e) By how much does output increase if there is an aggregate demand shock that increases g by 0.01

Step by Step Solution

There are 3 Steps involved in it

Step: 1

blur-text-image

Get Instant Access to Expert-Tailored Solutions

See step-by-step solutions with expert insights and AI powered tools for academic success

Step: 2

blur-text-image

Step: 3

blur-text-image

Ace Your Homework with AI

Get the answers you need in no time with our AI-driven, step-by-step assistance

Get Started

Recommended Textbook for

Excel As Your Database

Authors: Paul Cornell

1st Edition

1590597516, 978-1590597514

More Books

Students also viewed these Databases questions