Question
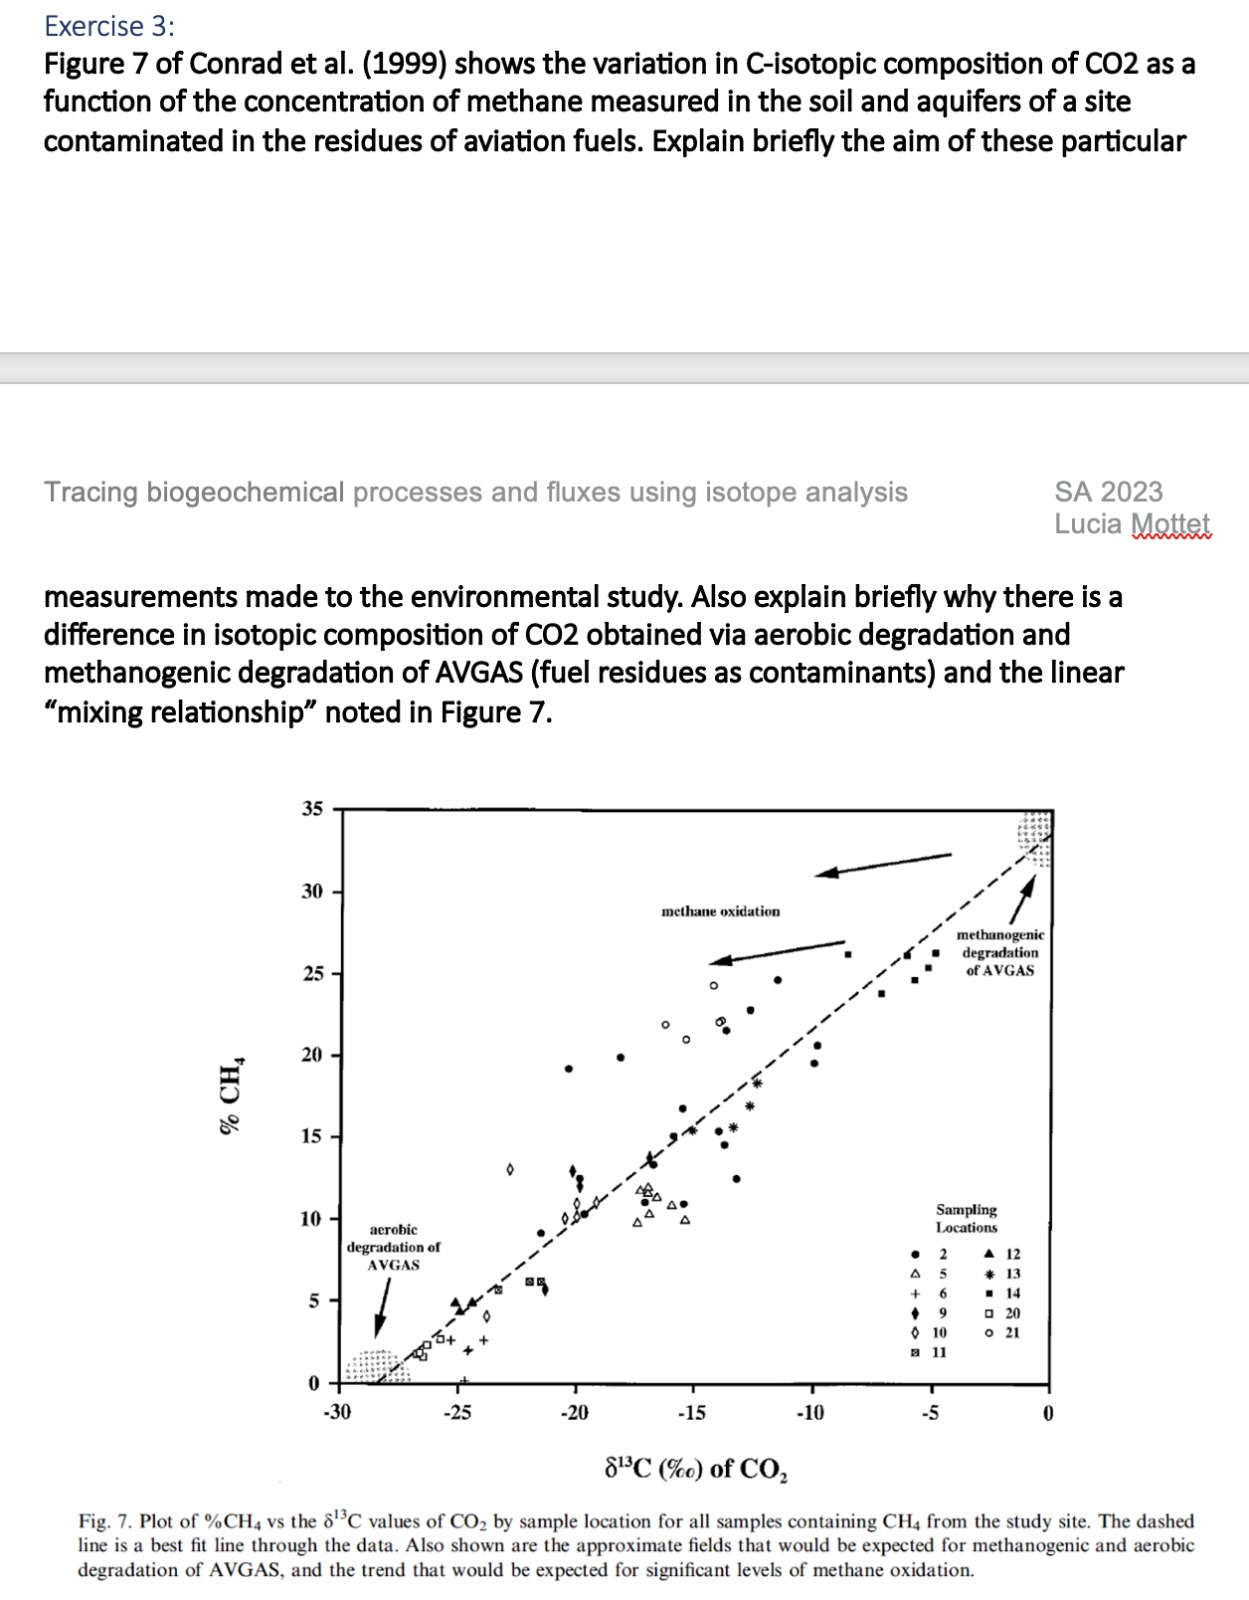
Exercise 3: Figure 7 of Conrad et al. (1999) shows the variation in C-isotopic composition of CO2 as a function of the concentration of methane
Exercise 3:\ Figure 7 of Conrad et al. (1999) shows the variation in C-isotopic composition of CO2 as a function of the concentration of methane measured in the soil and aquifers of a site contaminated in the residues of aviation fuels. Explain briefly the aim of these particular\ Tracing biogeochemical processes and fluxes using isotope analysis\ SA 2023\ Lucia Mottet\ measurements made to the environmental study. Also explain briefly why there is a difference in isotopic composition of
CO2obtained via aerobic degradation and methanogenic degradation of AVGAS (fuel residues as contaminants) and the linear "mixing relationship" noted in Figure 7.\ Fig. 7. Plot of
%CH_(4)vs the
\\\\delta ^(13)Cvalues of
CO_(2)by sample location for all samples containing
CH_(4)from the study site. The dashed line is a best fit line through the data. Also shown are the approximate fields that would be expected for methanogenic and aerobic degradation of AVGAS, and the trend that would be expected for significant levels of methane oxidation.

Step by Step Solution
There are 3 Steps involved in it
Step: 1

Get Instant Access to Expert-Tailored Solutions
See step-by-step solutions with expert insights and AI powered tools for academic success
Step: 2

Step: 3

Ace Your Homework with AI
Get the answers you need in no time with our AI-driven, step-by-step assistance
Get Started


