Answered step by step
Verified Expert Solution
Question
1 Approved Answer
Exercise 3: Probability (8 points) I calculated the proportions of different age groups of respondents, as well as proportions of different racial/ethnical groups in the
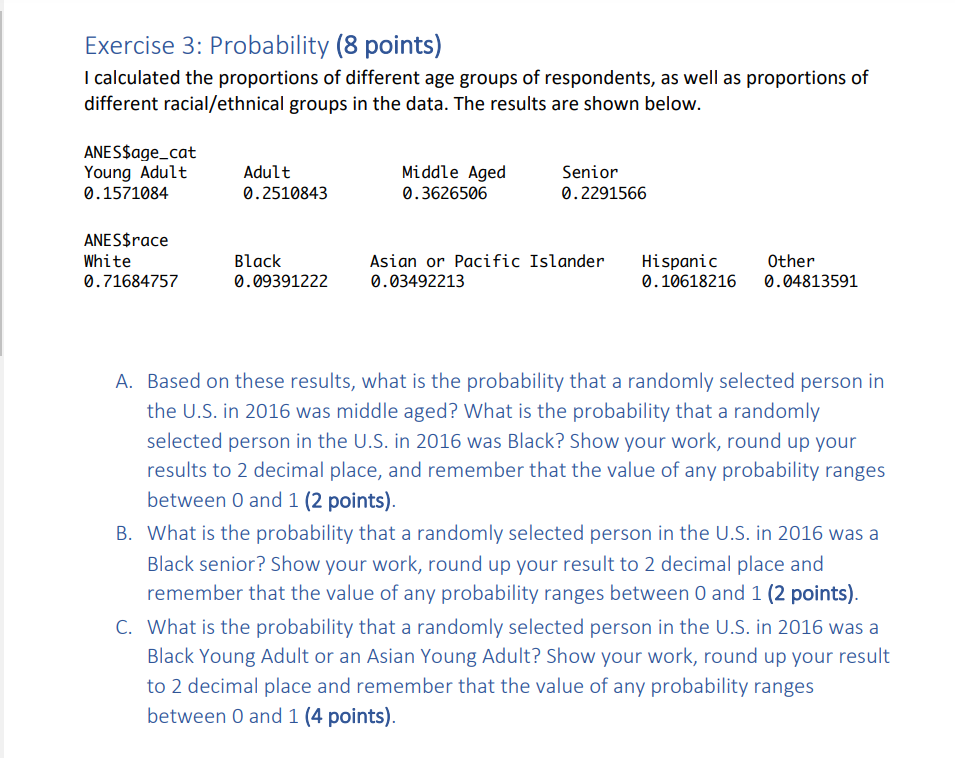
Exercise 3: Probability (8 points) I calculated the proportions of different age groups of respondents, as well as proportions of different racial/ethnical groups in the data. The results are shown below. ANE5$age_cat Young Adult Adult Middle Aged Senior 6. 1521684 6. 2516843 6 . 3626566 6. 2291566 ANESSrace White Black Asian or Pacific Islander Hispanic Other 6. 7168475? 6.69391222 6 . 63492213 6 . 16618216 6.64813591 A. Based on these results, what is the probability that a randomly selected person in the U.S. in 2016 was middle aged? What is the probability that a randomly selected person in the U.S. in 2016 was Black? Show your work, round up your results to 2 decimal place, and remember that the value of any probability ranges between 0 and 1 (2 points). B. What is the probability that a randomly selected person in the U.S. in 2016 was a Black senior? Show your work, round up your result to 2 decimal place and remember that the value of any probability ranges between 0 and 1 (2 points). C. What is the probability that a randomly selected person in the U.S. in 2016 was a Black Young Adult or an Asian Young Adult? Show your work, round up your result to 2 decimal place and remember that the value of any probability ranges between 0 and 1 (4 points)
Step by Step Solution
There are 3 Steps involved in it
Step: 1
Get Instant Access to Expert-Tailored Solutions
See step-by-step solutions with expert insights and AI powered tools for academic success
Step: 2
Step: 3
Ace Your Homework with AI
Get the answers you need in no time with our AI-driven, step-by-step assistance
Get Started