Answered step by step
Verified Expert Solution
Question
1 Approved Answer
Exercise 3-6 Toro's DuPont analysis for 2017 compared to 2016? Chapter 3 - Homework Forms RED COMPANY 91 Name: Section:- #:_- Exercise 3-1 Net Profit
Exercise 3-6 Toro's DuPont analysis for 2017 compared to 2016?
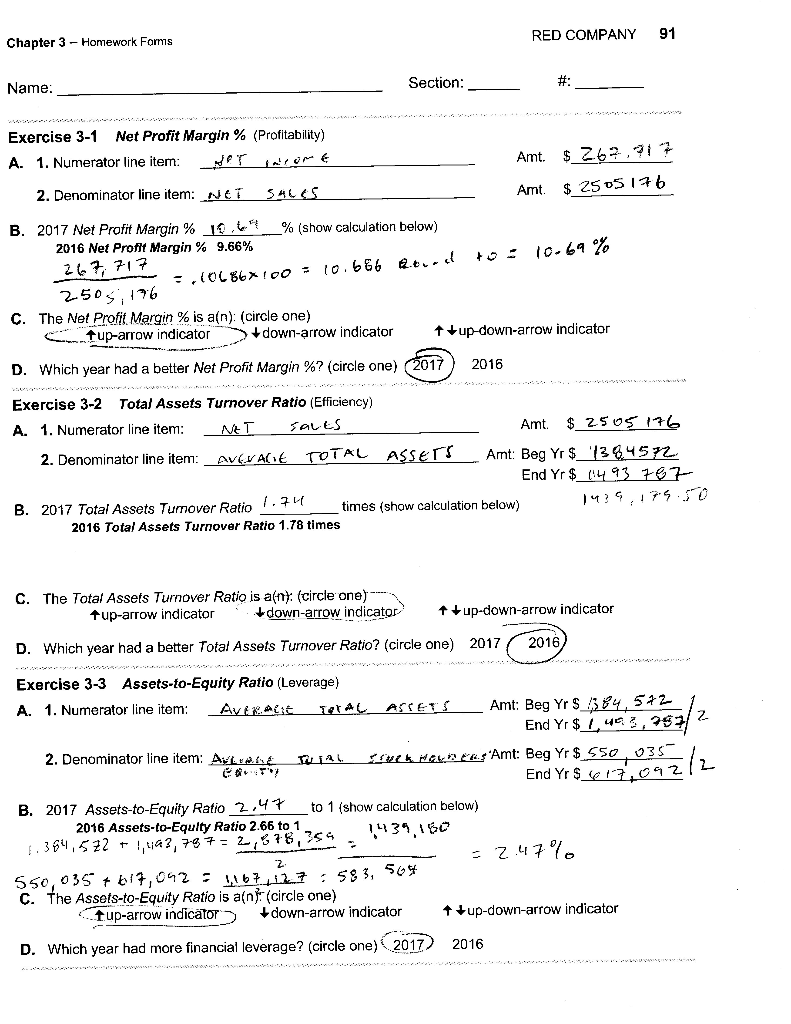
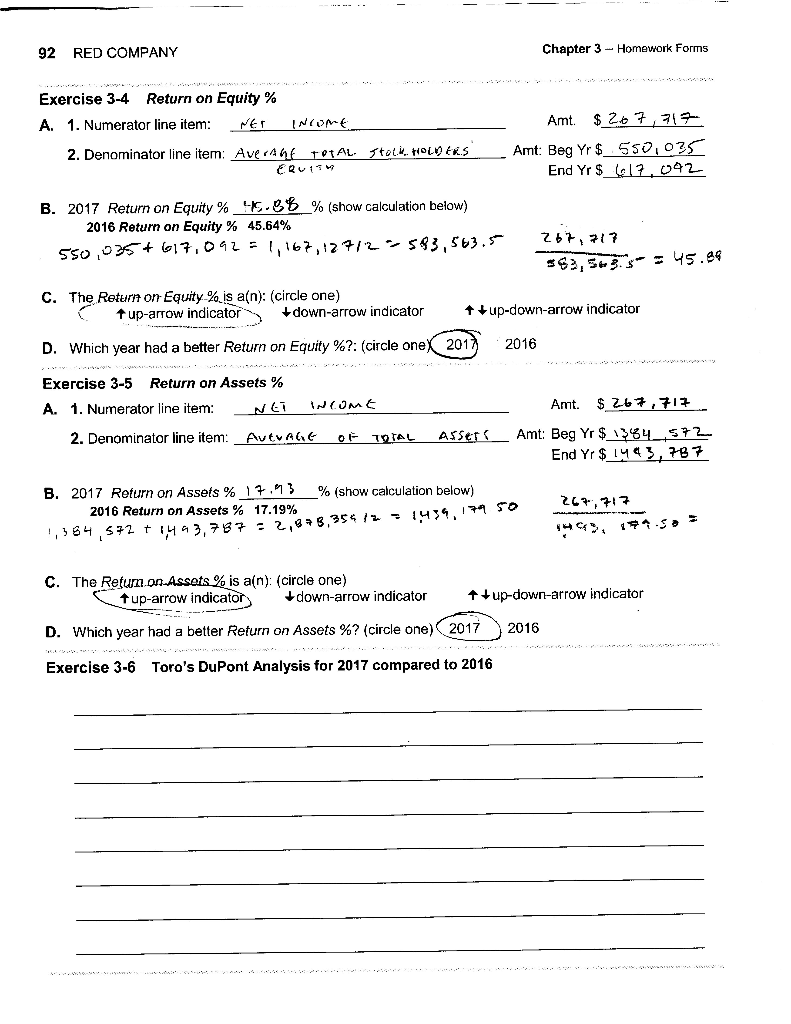
Chapter 3 - Homework Forms RED COMPANY 91 Name: Section:- #:_- Exercise 3-1 Net Profit Margin % (Profitability) A. 1. Numerator line item: NAT O M Amt. $ 262,91 Amt. $ 2505 176 2. Denominator line item: NET SALES : 10.64% B. 2017 Net Profit Margin % 10.64_% (show calculation below) 2016 Net Profil Margin % 9.66% 267, 717 2503;176 C. The Net Profit Margin % is a(n): (circle one) S t up-arrow indicator +down-arrow indicator , (0186*100 = 10.686 euro up-down-arrow indicator D. Which year had a better Net Profit Margin %? (circle one) (2017) 2016 Exercise 3-2 Total Assets Turnover Ratio (Efficiency) A. 1. Numerator line item: NET SALES Amt. $2505 176 2. Denominator line item: AVC ACE TOTAL ASSETS Art: Beg Yr $_1384572 End Yr $_(14 93 787 B. 2017 Total Assets Turnover Ratio 1:" times (show calculation below) 149, 179.50 2016 Total Assets Turnover Ratio 1.78 times C. The Total Assets Turnover Ratio is a(ny: (circle one) tup-arrow indicator +down-arrow indicator up-down-arrow indicator D. Which year had a better Total Assets Turnover Ratio? (circle one) 2017 2016 Exercise 3-3 Assets-to-Equity Ratio (Leverage) A. 1. Numerator line item: Aviat TIAL ASSETS Amt: Beg Yr $984,5221 End Yr $1,403,7972 2. Denominator line item: AWLW.AE k HALERS'Amt: Beg Yr $ 550 035 . End Yr $17,092 B. 2017 Assets-to-Equity Ratio 2.47 to 1 (show calculation below) 2016 Assets-to-Equity Ratio 2.66 to 1 1.384,522 + 1,493,79 7 = 2,578,754. 3. 2 - - 2.47%. 550, 035 + 617,042: 1167 1.27 : 583, 564 C. The Assets-to-Equity Ratio is an (circle one) Tup-arrow indicator down-arrow indicator tup-down-arrow indicator D. Which year had more financial leverage? (circle one) (2017) 2016 92 RED COMPANY Chapter 3 - Homework Forms Exercise 3-4 Return on Equity% A. 1. Numerator line item: NET INOM 2. Denominator line item: Ave A total stoli to ENS ERU Amt. $267717 Amt: Beg Yr $ 550,035 End Yr $_617,042 B. 2017 Return on Equity % 45.88_% (show calculation below) 2016 Return on Equity % 45.64% 550,035+ (617,092 = 1,167, 12712 583 563.5 267, 717 563, 5w3s = 45.89 C. The Return on Equity-% is a(n): (circle one) fup-arrow indicator down-arrow indicator ++ up-down-arrow indicator D. Which year had a better Return on Equity %?: (circle oneX 2017 2016 Exercise 3-5 Return on Assets % A. 1. Numerator line item: Nei Woont Amt. $ 267,717 2. Denominator line item: AvdvALE OF TOTAL Asset_Amt: Beg Yr $ 1394_572 End Yr $1443, 787 B. 2017 Return on Assets %17.13 % (show calculation below) 2016 Return on Assets % 17.19% 1439.111 50 1,364,572 +1443.787 : 2,93,354/2 267,717 C. The Retun on Assets % is a(n): (circle one) tup-arrow indicator down-arrow indicator up-down-arrow indicator D. Which year had a better Return on Assets %? (circle one) 2017 2016 Exercise 3-6 Toro's DuPont Analysis for 2017 compared to 2016 Chapter 3 - Homework Forms RED COMPANY 91 Name: Section:- #:_- Exercise 3-1 Net Profit Margin % (Profitability) A. 1. Numerator line item: NAT O M Amt. $ 262,91 Amt. $ 2505 176 2. Denominator line item: NET SALES : 10.64% B. 2017 Net Profit Margin % 10.64_% (show calculation below) 2016 Net Profil Margin % 9.66% 267, 717 2503;176 C. The Net Profit Margin % is a(n): (circle one) S t up-arrow indicator +down-arrow indicator , (0186*100 = 10.686 euro up-down-arrow indicator D. Which year had a better Net Profit Margin %? (circle one) (2017) 2016 Exercise 3-2 Total Assets Turnover Ratio (Efficiency) A. 1. Numerator line item: NET SALES Amt. $2505 176 2. Denominator line item: AVC ACE TOTAL ASSETS Art: Beg Yr $_1384572 End Yr $_(14 93 787 B. 2017 Total Assets Turnover Ratio 1:" times (show calculation below) 149, 179.50 2016 Total Assets Turnover Ratio 1.78 times C. The Total Assets Turnover Ratio is a(ny: (circle one) tup-arrow indicator +down-arrow indicator up-down-arrow indicator D. Which year had a better Total Assets Turnover Ratio? (circle one) 2017 2016 Exercise 3-3 Assets-to-Equity Ratio (Leverage) A. 1. Numerator line item: Aviat TIAL ASSETS Amt: Beg Yr $984,5221 End Yr $1,403,7972 2. Denominator line item: AWLW.AE k HALERS'Amt: Beg Yr $ 550 035 . End Yr $17,092 B. 2017 Assets-to-Equity Ratio 2.47 to 1 (show calculation below) 2016 Assets-to-Equity Ratio 2.66 to 1 1.384,522 + 1,493,79 7 = 2,578,754. 3. 2 - - 2.47%. 550, 035 + 617,042: 1167 1.27 : 583, 564 C. The Assets-to-Equity Ratio is an (circle one) Tup-arrow indicator down-arrow indicator tup-down-arrow indicator D. Which year had more financial leverage? (circle one) (2017) 2016 92 RED COMPANY Chapter 3 - Homework Forms Exercise 3-4 Return on Equity% A. 1. Numerator line item: NET INOM 2. Denominator line item: Ave A total stoli to ENS ERU Amt. $267717 Amt: Beg Yr $ 550,035 End Yr $_617,042 B. 2017 Return on Equity % 45.88_% (show calculation below) 2016 Return on Equity % 45.64% 550,035+ (617,092 = 1,167, 12712 583 563.5 267, 717 563, 5w3s = 45.89 C. The Return on Equity-% is a(n): (circle one) fup-arrow indicator down-arrow indicator ++ up-down-arrow indicator D. Which year had a better Return on Equity %?: (circle oneX 2017 2016 Exercise 3-5 Return on Assets % A. 1. Numerator line item: Nei Woont Amt. $ 267,717 2. Denominator line item: AvdvALE OF TOTAL Asset_Amt: Beg Yr $ 1394_572 End Yr $1443, 787 B. 2017 Return on Assets %17.13 % (show calculation below) 2016 Return on Assets % 17.19% 1439.111 50 1,364,572 +1443.787 : 2,93,354/2 267,717 C. The Retun on Assets % is a(n): (circle one) tup-arrow indicator down-arrow indicator up-down-arrow indicator D. Which year had a better Return on Assets %? (circle one) 2017 2016 Exercise 3-6 Toro's DuPont Analysis for 2017 compared to 2016Step by Step Solution
There are 3 Steps involved in it
Step: 1

Get Instant Access to Expert-Tailored Solutions
See step-by-step solutions with expert insights and AI powered tools for academic success
Step: 2

Step: 3
Ace Your Homework with AI
Get the answers you need in no time with our AI-driven, step-by-step assistance
Get Started