

Answered step by step
Verified Expert Solution
Question
1 Approved Answer
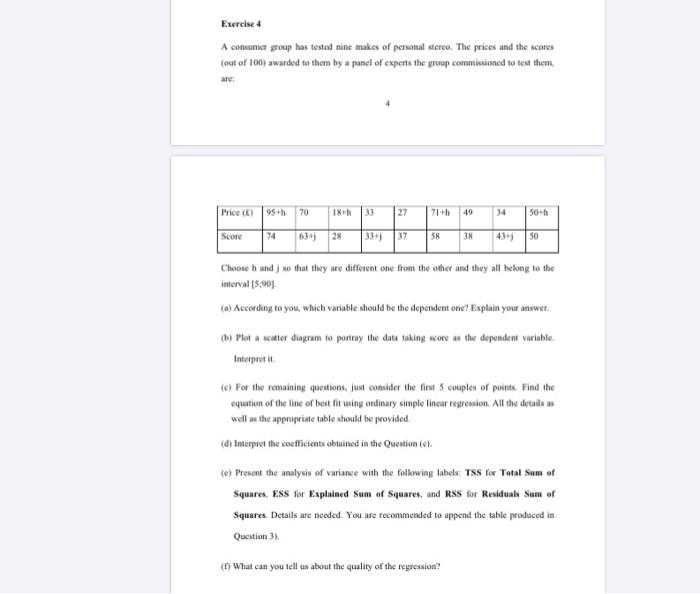
Exercise 4 A consumat group has tested nine makes of personal stereo. The prices and the scores (out of 100) awarded to them by a
Step by Step Solution
There are 3 Steps involved in it
Step: 1

Get Instant Access to Expert-Tailored Solutions
See step-by-step solutions with expert insights and AI powered tools for academic success
Step: 2

Step: 3
Ace Your Homework with AI
Get the answers you need in no time with our AI-driven, step-by-step assistance
Get Started
The Routledge Handbook Of FinTech
Authors: K. Thomas Liaw
1st Edition
0367263599, 978-0367263591