Answered step by step
Verified Expert Solution
Link Copied!

Question

1 Approved Answer

Exercise 4. (Use Excel or similar) Recall from class that the Black-Scholes formula for a European call option at current time { with maturity T
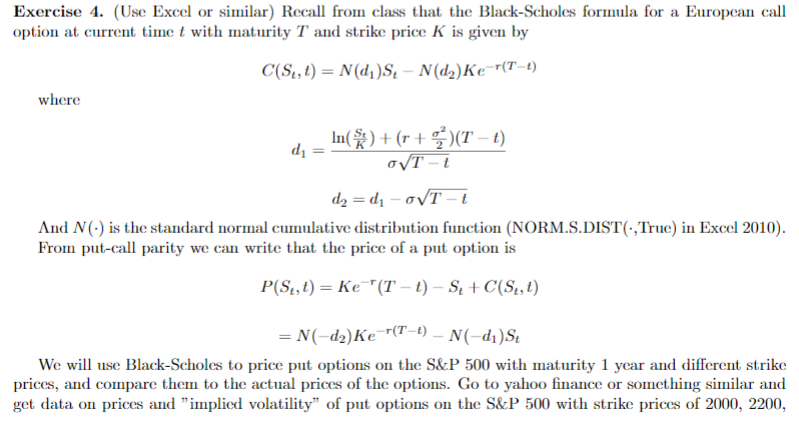
image text in transcribedimage text in transcribed
Exercise 4. (Use Excel or similar) Recall from class that the Black-Scholes formula for a European call option at current time { with maturity T and strike price K is given by C(St, t) = N(d,)S, - N(d2) Ke (T-1) where dj = In(* ) + (7 + = ) (T -t) OVT-t d2 = chi -ovT-t And N(.) is the standard normal cumulative distribution function (NORM.S.DIST(., True) in Excel 2010). From put-call parity we can write that the price of a put option is P(S,, t) = Ke (T -t) - S, + C(S, t) = N(-d2)Ke T(T-1) - N(-di)St We will use Black-Scholes to price put options on the S&P 500 with maturity 1 year and different strike prices, and compare them to the actual prices of the options. Go to yahoo finance or something similar and get data on prices and "implied volatility" of put options on the S&P 500 with strike prices of 2000, 2200,2100, 2600, 2800, and 3000 and maturity as close to 1 year as you can find (so about May 2021). Next, using the current level of the S&P 500 as St, the current fed funds rate as r, T = 1 and t = 0 (for maturity one year), and volatility o = 0.18 (about the historical annual volatility of the S&P 500), calculate the Black-Scholes prices of each of the put options with their strike prices. Then calculate the percent change from the actual option price to the Black-Scholes price (i.c., (B-S price minus Actual Price)/Actual Price). Which options does the Black-Scholes price miss by the largest percentages? Lastly, create two graphs: On the first, put strike prices on the X-axis and plot lines for the actual prices and the Black-Scholes prices. On the second, put strike prices on the X-axis and plot lines for the implied volatilities and our assumed volatility (a straight line at 0.18). Discuss your findings in a few sentences

Step by Step Solution

There are 3 Steps involved in it

Step: 1

blur-text-image

Get Instant Access to Expert-Tailored Solutions

See step-by-step solutions with expert insights and AI powered tools for academic success

Step: 2

blur-text-image_2

Step: 3

blur-text-image_3

Ace Your Homework with AI

Get the answers you need in no time with our AI-driven, step-by-step assistance

Get Started

Recommended Textbook for

Econometric Analysis

Authors: William H. Greene

5th Edition

130661899, 978-0130661890

More Books

Students also viewed these Economics questions

Question

How does an agenda help make a meeting more successful?

Answered: 1 week ago

Question

recall the elements of policy development in the union environment

Answered: 1 week ago

Question

why do consumers often fail to seek out higher yields on deposits ?

Answered: 1 week ago