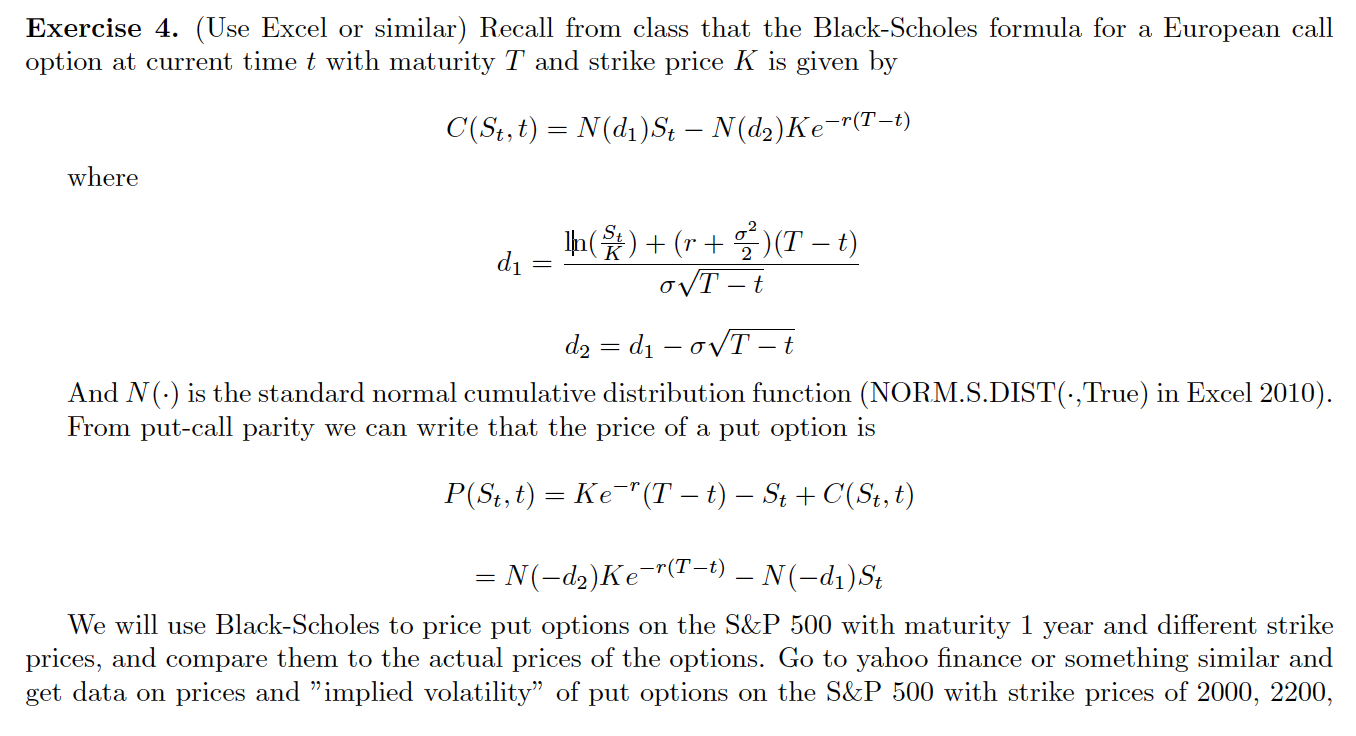
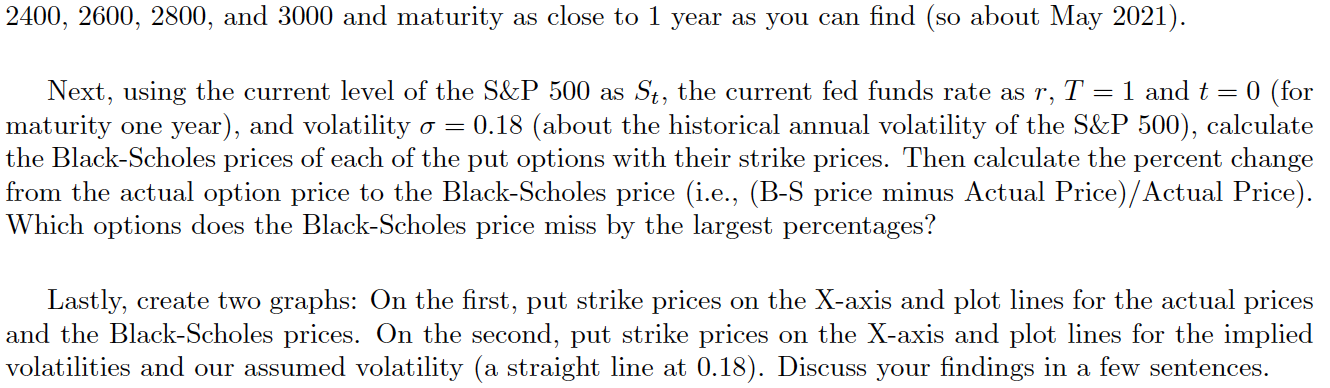
Exercise 4. (Use Excel or similar) Recall from class that the Black-Scholes formula for a European call option at current time t with maturity T and strike price K is given by C(St,t) = N(d)St N(d2)Ke-r(Tt) where d = di _ Ihn(*) + (r + 3)(T t) OVT - t d2 = d -OVT - t And N() is the standard normal cumulative distribution function (NORM.S.DIST(:,True) in Excel 2010). From put-call parity we can write that the price of a put option is P(St,t) = Ke="(T t) - St + C(St,t) = N(-d2)Ke-r(Tt) N(-d)St We will use Black-Scholes to price put options on the S&P 500 with maturity 1 year and different strike prices, and compare them to the actual prices of the options. Go to yahoo finance or something similar and get data on prices and "implied volatility of put options on the S&P 500 with strike prices of 2000, 2200, 2400, 2600, 2800, and 3000 and maturity as close to 1 year as you can find (so about May 2021). Next, using the current level of the S&P 500 as St, the current fed funds rate as r, T = 1 and t = 0) (for maturity one year), and volatility o = 0.18 (about the historical annual volatility of the S&P 500), calculate the Black-Scholes prices of each of the put options with their strike prices. Then calculate the percent change from the actual option price to the Black-Scholes price (i.e., (B-S price minus Actual Price)/Actual Price). Which options does the Black-Scholes price miss by the largest percentages? Lastly, create two graphs: On the first, put strike prices on the X-axis and plot lines for the actual prices and the Black-Scholes prices. On the second, put strike prices on the X-axis and plot lines for the implied volatilities and our assumed volatility (a straight line at 0.18). Discuss your findings in a few sentences. Exercise 4. (Use Excel or similar) Recall from class that the Black-Scholes formula for a European call option at current time t with maturity T and strike price K is given by C(St,t) = N(d)St N(d2)Ke-r(Tt) where d = di _ Ihn(*) + (r + 3)(T t) OVT - t d2 = d -OVT - t And N() is the standard normal cumulative distribution function (NORM.S.DIST(:,True) in Excel 2010). From put-call parity we can write that the price of a put option is P(St,t) = Ke="(T t) - St + C(St,t) = N(-d2)Ke-r(Tt) N(-d)St We will use Black-Scholes to price put options on the S&P 500 with maturity 1 year and different strike prices, and compare them to the actual prices of the options. Go to yahoo finance or something similar and get data on prices and "implied volatility of put options on the S&P 500 with strike prices of 2000, 2200, 2400, 2600, 2800, and 3000 and maturity as close to 1 year as you can find (so about May 2021). Next, using the current level of the S&P 500 as St, the current fed funds rate as r, T = 1 and t = 0) (for maturity one year), and volatility o = 0.18 (about the historical annual volatility of the S&P 500), calculate the Black-Scholes prices of each of the put options with their strike prices. Then calculate the percent change from the actual option price to the Black-Scholes price (i.e., (B-S price minus Actual Price)/Actual Price). Which options does the Black-Scholes price miss by the largest percentages? Lastly, create two graphs: On the first, put strike prices on the X-axis and plot lines for the actual prices and the Black-Scholes prices. On the second, put strike prices on the X-axis and plot lines for the implied volatilities and our assumed volatility (a straight line at 0.18). Discuss your findings in a few sentences