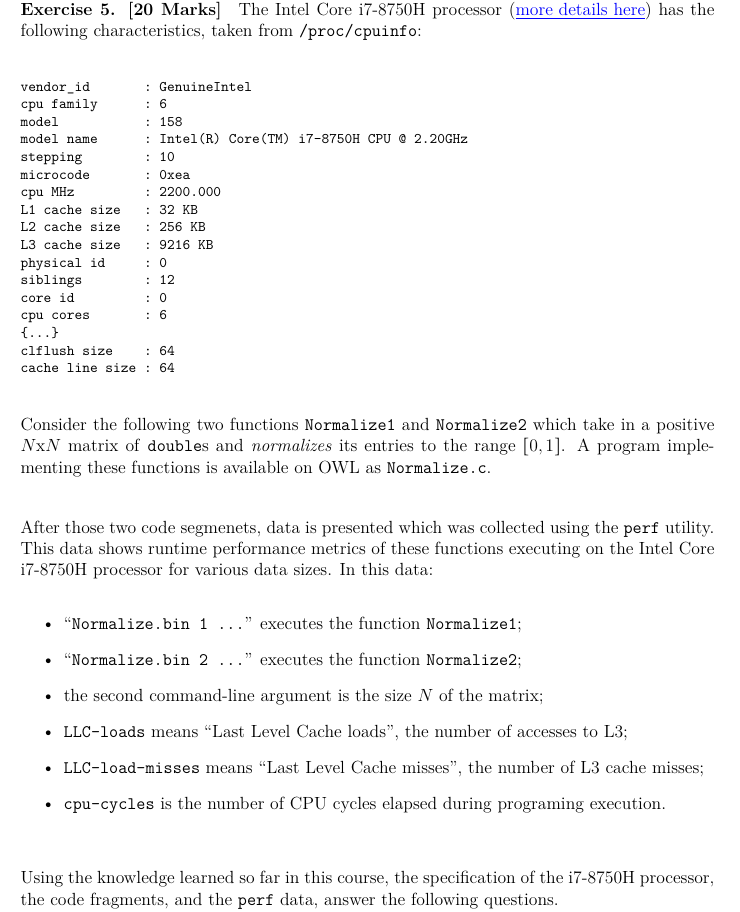
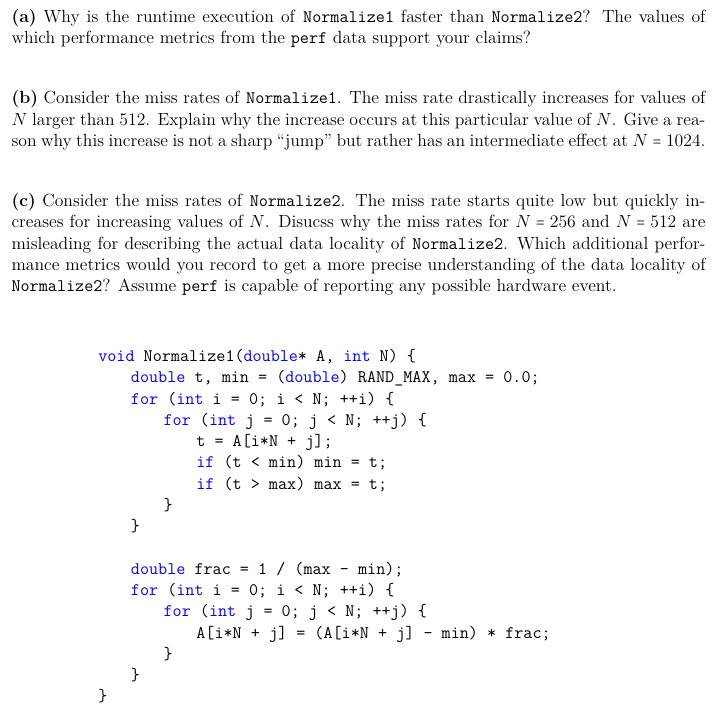
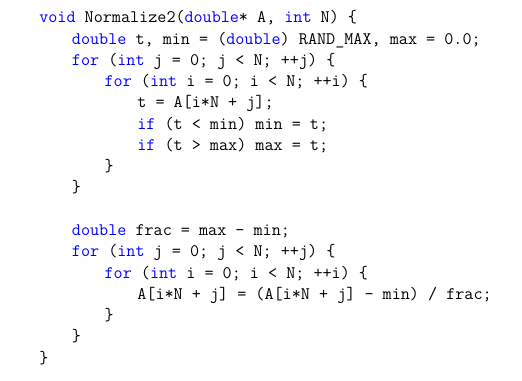
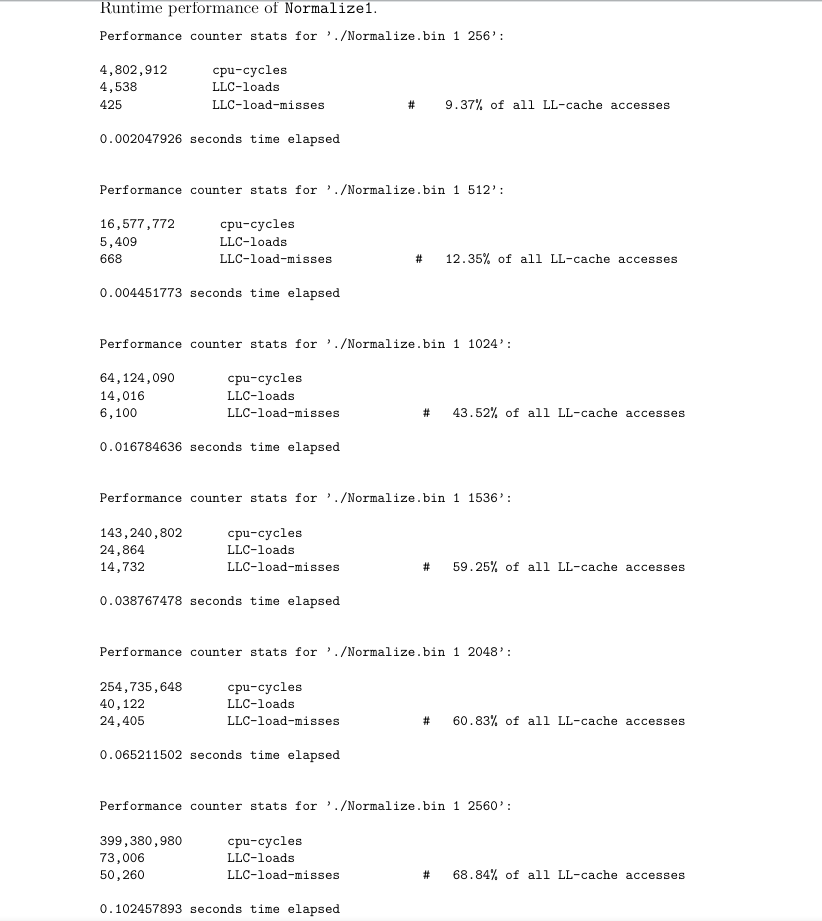
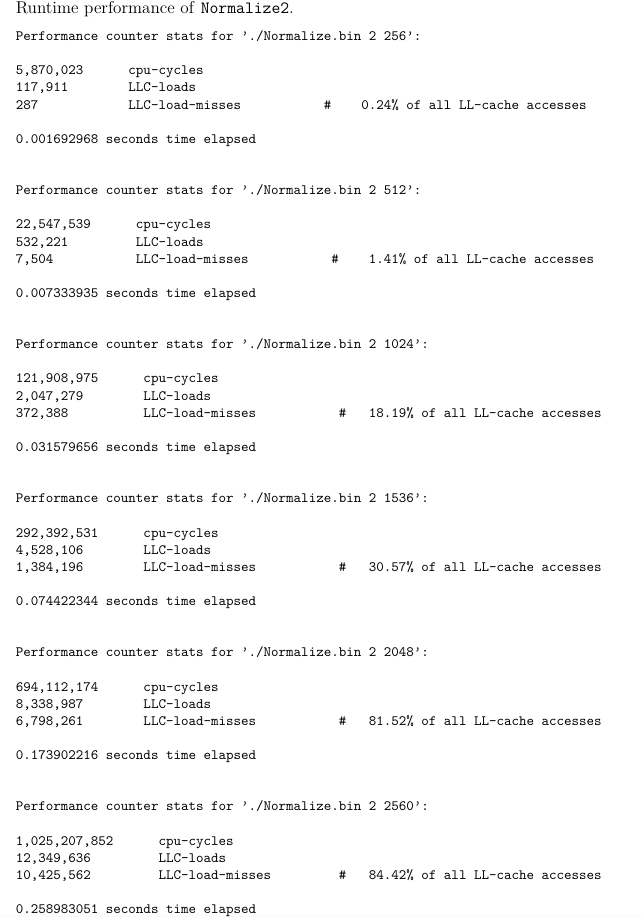
Exercise 5. [20 Marks] The Intel Core i7-8750H processor has the following characteristics, taken from /proc/cpuinfo: \( \begin{array}{ll}\text { vendor_id } & : \text { GenuineIntel } \\ \text { cpu family } & : 6 \\ \text { model } & : 158 \\ \text { model name } & : \text { Intel(R) Core(TM) i7-8750H CPU @ 2.20GHz } \\ \text { stepping } & : 10 \\ \text { microcode } & : 0 \text { Nea } \\ \text { cpu MHz } & : 2200.000 \\ \text { L1 cache size } & : 32 \mathrm{~KB} \\ \text { L2 cache size } & : 256 \mathrm{~KB} \\ \text { L3 cache size } & : 9216 \mathrm{~KB} \\ \text { physical id } & : 0 \\ \text { siblings } & : 12 \\ \text { core id } & : 0 \\ \text { cpu cores } & : 6 \\ \text { \{...\} } & : 64 \\ \text { clflush size } & : 64 \\ \text { cache line size } & : 64\end{array} \) Consider the following two functions Normalize1 and Normalize2 which take in a positive NxN matrix of doubles and normalizes its entries to the range [0,1]. A program implementing these functions is available on OWL as Normalize.c. After those two code segmenets, data is presented which was collected using the perf utility. This data shows runtime performance metrics of these functions executing on the Intel Core i7-8750H processor for various data sizes. In this data: - "Normalize.bin 1 ..." executes the function Normalize1; - "Normalize.bin 2 ..." executes the function Normalize2; - the second command-line argument is the size N of the matrix; - LLC-loads means "Last Level Cache loads", the number of accesses to L3; - LLC-load-misses means "Last Level Cache misses", the number of L3 cache misses; - cpu-cycles is the number of CPU cycles elapsed during programing execution. Using the knowledge learned so far in this course, the specification of the i7-8750H processor, (a) Why is the runtime execution of Normalize1 faster than Normalize2? The values of which performance metrics from the perf data support your claims? (b) Consider the miss rates of Normalize1. The miss rate drastically increases for values of N larger than 512. Explain why the increase occurs at this particular value of N. Give a reason why this increase is not a sharp "jump" but rather has an intermediate effect at N=1024. (c) Consider the miss rates of Normalize2. The miss rate starts quite low but quickly increases for increasing values of N. Disucss why the miss rates for N=256 and N=512 are misleading for describing the actual data locality of Normalize2. Which additional performance metrics would you record to get a more precise understanding of the data locality of Normalize2? Assume perf is capable of reporting any possible hardware event. Runtime performance of Normalize1. Performance counter stats for '. Normalize.bin 1 256': 4,802,9124,538425cpu-cyclesLLC-loadsLLC-load-misses#9.37%ofallLL-cacheaccesses 0.002047926 seconds time elapsed Performance counter stats for './Normalize.bin 1 512': 16,577,772 cpu-cycles 5,409 LLC-loads 668 LLC-load-misses 12.35% of all LL-cache accesses 0.004451773 seconds time elapsed Performance counter stats for ' /Normalize.bin 1 1024': 64,124,090 cpu-cycles 14,016 LLC-loads 6,100 LLC-load-misses \# 43.52% of all LL-cache accesses 0.016784636 seconds time elapsed Performance counter stats for './Normalize.bin 1 1536': 143,240,802cpucycles 24,864 LLC-loads LLC-load-misses \# L 59.25% of all LL-cache accesses 0.038767478 seconds time elapsed Performance counter stats for './Normalize.bin 1 2048': 254,735,648 cpu-cycles 40,122 LLC-loads 24,405 LLC-load-misses 60.83% of all LL-cache accesses 0.065211502 seconds time elapsed Performance counter stats for '. /Normalize.bin 1 2560': 399,380,980 cpu-cycles 73,006 LLC-loads 50,260 LLC-load-misses 68.84% of all LL-cache accesses 0.102457893 seconds time elapsed Runtime performance of Normalize2. Performance counter stats for './Normalize.bin 2 256': 5,870,023117,911287cpu-cyclesLLC-loadsLLC-load-misses#0.24%ofallLL-cacheaccesses 0.001692968 seconds time elapsed Performance counter stats for './Normalize.bin 2 512': 0.007333935 seconds time elapsed Performance counter stats for './Normalize.bin 2 1024': 121,908,975 cpu-cycles 2,047,279 LLC-loads 372,388 LLC-load-misses 18.19% of all LL-cache accesses 0.031579656 seconds time elapsed Performance counter stats for './Normalize.bin 2 1536': 292,392,531 cpu-cycles 4,528,106 LLC-loads 1,384,196 LLC-load-misses 30.57% of all LL-cache accesses 0.074422344 seconds time elapsed Performance counter stats for ' /Normalize.bin 2 2048': 694,112,174 cpu-cycles 8,338,987 LLC-loads 6,798,261 LLC-load-misses 81.52% of all LL-cache accesses 0.173902216 seconds time elapsed Performance counter stats for './Normalize.bin 2 2560': 1,025,207,852 cpu-cycles 12,349,636 LLC-loads 10,425,562 LLC-load-misses 84.42% of all LL-cache accesses 0.258983051 seconds time elapsed