

Answered step by step
Verified Expert Solution
Question
1 Approved Answer
Exercise 5. Normal distribution of equity returns (01.5 marks) (make your own research) 1. Comment the following graphs representing the evolution over time of three
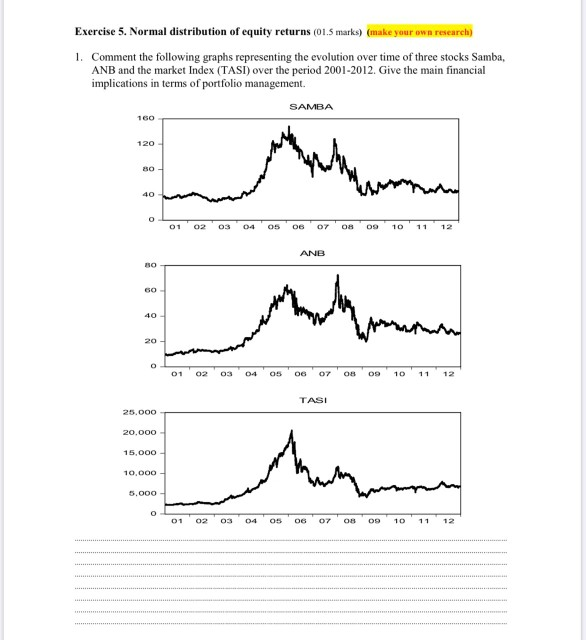
Exercise 5. Normal distribution of equity returns (01.5 marks) (make your own research) 1. Comment the following graphs representing the evolution over time of three stocks Samba, ANB and the market Index (TASI) over the period 2001-2012. Give the main financial implications in terms of portfolio management. SAMBA 160 01 02 03 04 05 06 07 08 09 10 11 ANB 01 02 03 04 05 06 07 08 09 10 11 TASI 25,000 20.000 15.000 10,000 5,000 01 02 03 04 05 06 07 08 09 10 11 12
Step by Step Solution
There are 3 Steps involved in it
Step: 1

Get Instant Access to Expert-Tailored Solutions
See step-by-step solutions with expert insights and AI powered tools for academic success
Step: 2

Step: 3
Ace Your Homework with AI
Get the answers you need in no time with our AI-driven, step-by-step assistance
Get Started
Principles Of Macroeconomics
Authors: Frank, Bernanke, Antonovics, Heffetz
3rd Edition
1259117162, 9781259117169