Answered step by step
Verified Expert Solution
Question
1 Approved Answer
Exercise 6-11 Suppose this information is available for PepsiCo, Inc. for 2015, 2016, and 2017. Exercise 6-11 Suppose this information is available for PepsiCo, Inc.
Exercise 6-11
Suppose this information is available for PepsiCo, Inc. for 2015, 2016, and 2017.
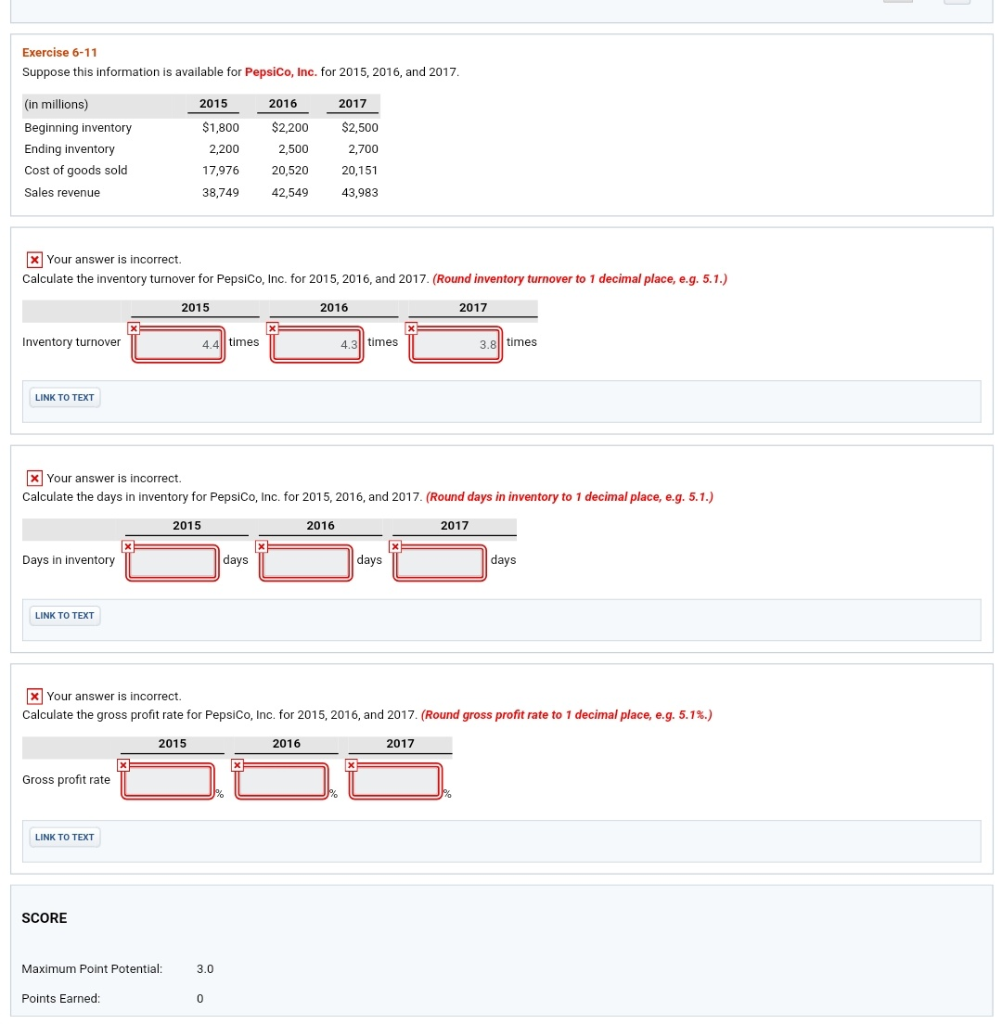
Exercise 6-11 Suppose this information is available for PepsiCo, Inc. for 2015, 2016, and 2017 (in millions) Beginning inventory Ending inventory Cost of goods sold Sales revenue 2015 2016 2017 $1,800 $2,200 $2,500 2,500 20,520 38,749 42,549 43,983 2,200 17,976 2,700 20,151 x Your answer is incorrect. Calculate the inventory turnover for PepsiCo, Inc. for 2015, 2016, and 2017. (Round inventory turnover to 1 decimal place, e.g. 5.1.) 2015 2016 2017 Inventory turnover 4.4 times 4.3 times 3.8 times LINK TO TEXT XYour answer is incorrect. Calculate the days in inventory for PepsiCo, Inc. for 2015, 2016, and 2017. (Round days in inventory to 1 decimal place, e.g. 5.1.) 2015 2016 2017 Days in inventory days days days LINK TO TEXT x Your answer is incorrect. Calculate the gross profit rate for PepsiCo, Inc. for 2015, 2016, and 2017, (Round gross profit rate to 1 decimal place, eg. 5.1%) 2015 2016 2017 Gross profit rate LINK TO TEXT SCORE Maximum Point Potential 3.0 Points Earned 0Step by Step Solution
There are 3 Steps involved in it
Step: 1
Get Instant Access to Expert-Tailored Solutions
See step-by-step solutions with expert insights and AI powered tools for academic success
Step: 2
Step: 3
Ace Your Homework with AI
Get the answers you need in no time with our AI-driven, step-by-step assistance
Get Started