Answered step by step
Verified Expert Solution
Question
1 Approved Answer
Exercise 9. Further empirically testing the steady state prediction of the basic Solow model This exercise anticipates some issues taken up in succeeding chapters, and
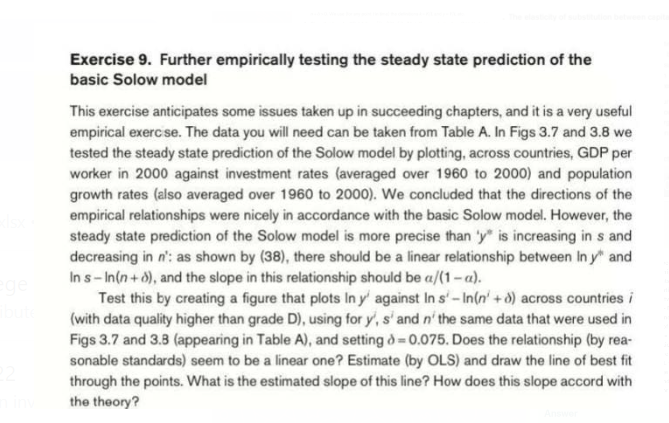
Exercise 9. Further empirically testing the steady state prediction of the basic Solow model This exercise anticipates some issues taken up in succeeding chapters, and it is a very useful empirical exercise. The data you will need can be taken from Table A. In Figs 3.7 and 3.8 we tested the steady state prediction of the Solow model by plotting, across countries, GDP per worker in 2000 against investment rates (averaged over 1960 to 2000) and population growth rates (also averaged over 1960 to 2000). We concluded that the directions of the empirical relationships were nicely in accordance with the basic Solow model. However, the steady state prediction of the Solow model is more precise than 'y" is increasing in s and decreasing in n': as shown by (38), there should be a linear relationship between In y* and ge In s - In(n + 6), and the slope in this relationship should be a/(1 - a). Test this by creating a figure that plots In y' against In s' - In(n' + ) across countries / (with data quality higher than grade D), using for y', s' and n' the same data that were used in Figs 3.7 and 3.8 (appearing in Table A), and setting d = 0.075. Does the relationship (by rea- sonable standards) seem to be a linear one? Estimate (by OLS) and draw the line of best fit through the points. What is the estimated slope of this line? How does this slope accord with the theory
Step by Step Solution
There are 3 Steps involved in it
Step: 1
Get Instant Access to Expert-Tailored Solutions
See step-by-step solutions with expert insights and AI powered tools for academic success
Step: 2
Step: 3
Ace Your Homework with AI
Get the answers you need in no time with our AI-driven, step-by-step assistance
Get Started