Question
Exercise Evaluating the Financial Impact of Human Resource Management Activities: Reducing the Cost of Turnover Procedures Read the entire exercise, including the Background on the
Exercise
Evaluating the Financial Impact of Human Resource Management Activities: Reducing the Cost of Turnover
Procedures
Read the entire exercise, including the Background on the Charlotte Health System and the three exhibits. Using the data in the exhibits, do the calculations (on your own, prior to class) requested on Form 1.3. Then, assemble groups of three to five students during the class period and discuss each of the questions. At the end of the class period, have a spokesperson for each group discuss the groups answers and rationale with the entire class.
Background
The healthcare industry has undergone dramatic change and restructuring during the decade of the 1990s and early 2000s. Mergers, consolidations, and downsizing have become the norm as organizations struggled to provide more cost-effective, high-quality services demanded by managed-care organizations and corporate employers. A major response to these pressures has been the development of integrated delivery systems, which typically combine multiple units of hospitals, physician practices, outpatient facilities, long-term care facilities, and insurance.
The goal of these systems is to provide seamless care through internal referrals, a common electronic medical record, common policies and procedures, etc. However, the reality has been somewhat less than a total success. Among the problems identified have been differences in values and incentives between the organizational units, lack of top management knowledge of some of the units acquired, and inability to integrate the different units clinically and managerially.
The Charlotte (North Carolina) Health System was developed from a base of a public hospital to which various delivery sites were added after Harry Majors became CEO 15 years ago. Since his arrival, Majors and his executive team have created the dominant health system in North Carolina. Despite this success, the system continues to be under pressure from employers and managed-care organizations to further reduce its costs and document both clinical quality and cost-effectiveness.
Almost four years ago, Majors and the board of directors decided that the time had come to professionalize the human resource function since the organizations they had purchased or aligned with exhibited varying degrees of sophistication and vastly different policies and procedures. Betty Williams was recruited from another health system as the new VP for Human Resources. Williams came to her job after completion of an MA degree in Human Resources Management from the University of Alabama and 16 years of experience in the
Exercise 6 Evaluating the Financial Impact of Human Resource Management Activities: Reducing the Cost of Turnover


field. During the three years she has been at Charlotte Health System, she has hired three new HRM staffpersons in recruitment, employee benefits, and compensation.
H.R. Cost Justification
As the Board has considered how to reduce the cost of service delivery in the system, the corporate office in general, and the Human Resources Department in particular, have come under increased scrutiny. Williams has been told she needed to justify the additional budget allocation to her department over the past three years. Exhibit 1.6 shows her departments budget for year one (the year prior to her arrival) as well as the three years since her arrival. The board has calculated the extra costs of the Human Resources Department over the past three years (using year one as the base) to be $680,000. The largest percentage cost increases were in salaries and benefits and in equipment and supplies. Most of the latter increases were the result of upgrades in computer hardware and software.
The Board has scheduled a meeting for next Monday. One of the agenda items is to examine the costs of the Human Resource Management Department with the possibility of a budget cut for next year. Williams has been asked to make a presentation to justify her budget and how expansion of her department has contributed to the systems bottom line. She has considered a number of changes she made which she believes have improved overall system performance. Among these were the development of system career ladders to increase employee retention, in-house management training programs to improve management com- petence, development of model staffing ratios to reduce employee stress and burnout, quarterly performance reviews to increase employee feedback, absenteeism incentive pro- grams, and initiation of an annual employee survey to identify problem areas.
After some discussion with her staff, Williams decided that it would be easier to document the benefits of increased employee retention. Exhibit 1.7 shows the employee
EXHIBIT 1.7 Annual Turnover Rate by Category for Years One through Four


turnover by category for year one (the year before Williamss arrival) as well as for each of the following three years since her arrival. These data show a decline in turnover for all four personal categories over the four-year period.
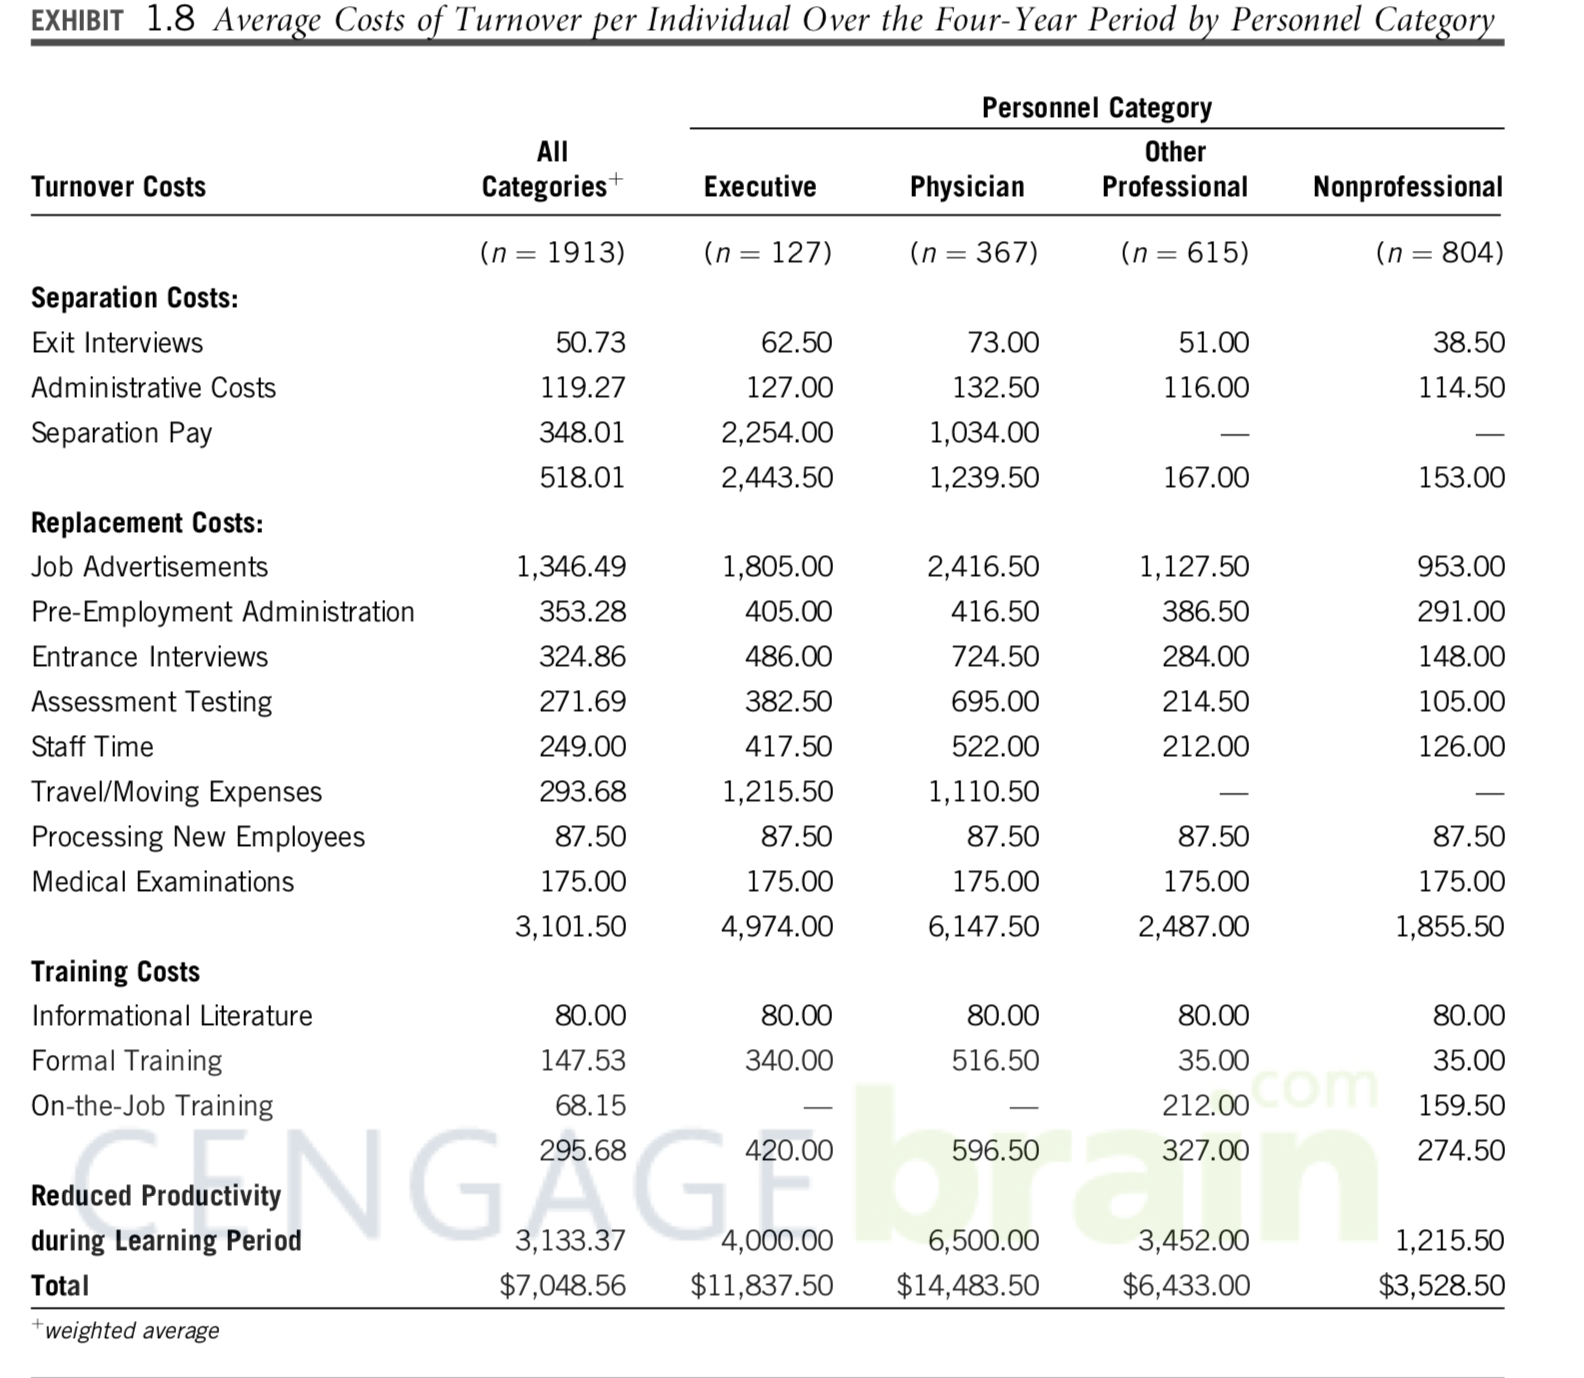
Williams and her staff have calculated the average cost of turnover per employee by personnel category and these calculations are shown in Exhibit 1.8. Most of these calculations can be documented from personnel records. The exception is the reduced productivity during the learning period. For these calculations, the staff calculated the average monthly productivity for a small sub-sample of the individuals who left and compared it to the average monthly productivity of those who replaced them during their first three months. They then calculated the dollar cost of this lost productivity for a one-year period.
Their assumption is that the lower productivity continues at the same level for a 12-month period and then disappears. More realistically, the lower productivity probably declines over time but continues for longer than a 12-month period. However, they feel their method of calculation is a good approximation of reality since their overestimation of the productivity loss is offset by the shorter time period of their calculations.
Exhibit 1.8 shows that the total cost for each individual who leaves the Charlotte Health System averages $7,049 but this varies from a high of $14,484 for physicians to a low of $3,644 for nonprofessional employees. These costs are divided into separation costs, replacement costs, training costs, and costs of reduced productivity (for the new employee) during the (assumed) one-year learning period.
Questions
Are the calculated benefits of reduced turnover sufficient to justify the $680,000 in increased costs associated with the expansion of the Human Resource Management Department? Would your answer be the same if reduced productivity during the learning period was excluded from the analysis?
In addition to improved employee retention, what are some other areas of potential economic benefit to the organization from having a Human Resource Department? What calculations would you do to prove such benefits?
Complete Form 1.3 on p. 25 in an Excel spreadsheet.
 EXHIBIT 1.8 Average Costs of Turnover per Individual Over the Four-Year Period by Personnel Category \begin{tabular}{lrrrr} \multicolumn{5}{c}{ Department Budget per Year } \\ \hline Budget Cost & \multicolumn{1}{c}{ One } & \multicolumn{1}{c}{ Two } & Three & Four \\ \hline Salaries and Benefits & $110,000 & $233,000 & $288,000 & $324,000 \\ Equipment and Supplies & 24,000 & 39,000 & 48,000 & 57,000 \\ Communications & 41,000 & 62,000 & 73,000 & 81,000 \\ Totals & $175,000 & $334,000 & $409,000 & $462,000 \\ \hline \end{tabular} FORM 1.3 Calculation of Benefits of Higher Employee Retention Using a Base of Year One Calculation of Savings or Loss: 1. Total Incremental Savings from Higher Employee Retention for all Personnel Categories for Years 2, 3, and 4. 2. Total Incremental Costs of the Human Resource Management Department Budget for Years 2, 3, and 4. Net Savings or Loss
 Step by Step Solution
There are 3 Steps involved in it
Step: 1

Get Instant Access to Expert-Tailored Solutions
See step-by-step solutions with expert insights and AI powered tools for academic success
Step: 2

Step: 3

Ace Your Homework with AI
Get the answers you need in no time with our AI-driven, step-by-step assistance
Get Started


