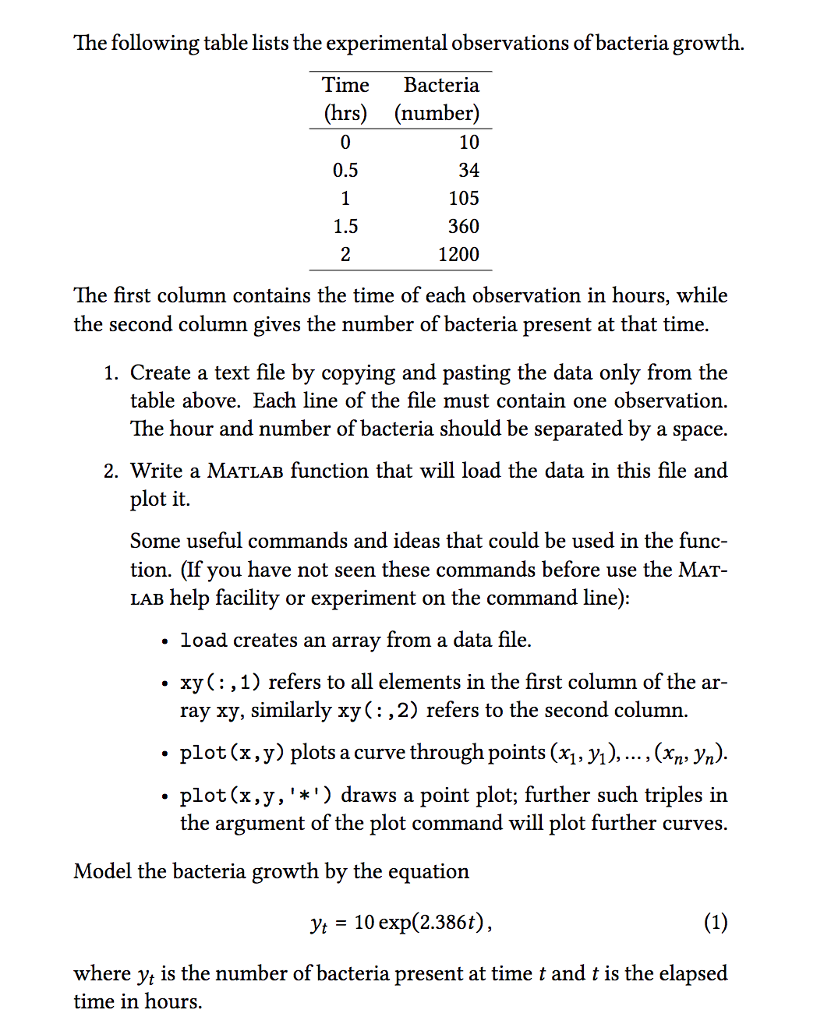
Exercises The following table lists the experimental observations of bacteria growth. Time Bacteria (hrs) (number) 0 10 0.5 34 1 105 1.5 360 2 1200

Exercises
The following table lists the experimental observations of bacteria growth.
Time Bacteria
(hrs) (number)
0 10
0.5 34
1 105
1.5 360
2 1200
The first column contains the time of each observation in hours, while
the second column gives the number of bacteria present at that time.
1.
Create a text file by copying and pasting the data only from the
table above. Each line of the file must contain one observation.
The hour and number of bacteria should be separated by a space.
2.
Write a Matlab function that will load the data in this file and
plot it.
Some useful commands and ideas that could be used in the func-
tion. (If you have not seen these commands before use the Mat-
lab help facility or experiment on the command line):
load
creates an array from a data file.
xy(:,1)
refers to all elements in the first column of the ar-
ray
xy
, similarly
xy(:,2)
refers to the second column.
plot(x,y)
plots a curve through points
plot (x,y)plots a curve through points (
plot(x,y,'*')
draws a point plot; further such triples in
the argument of the plot command will plot further curves.
Model the bacteria growth by the equation
= 10
exp
(2.38) ,
(1)
where
?
?
is the number of bacteria present at time
?
and
?
is the elapsed
time in hours.
3.
Write a Matlab function that uses Equation (
1
) to estima
The following table lists the experimental observations of bacteria growth. Time Bacteria (hrs) (number) 10 34 105 360 1200 0 0.5 1.5 The first column contains the time of each observation in hours, while the second column gives the number of bacteria present at that time. 1. Create a text file by copying and pasting the data only from the table above. Each line of the file must contain one observation The hour and number of bacteria should be separated by a space 2. Write a MATLAB function that will load the data in this file and plot it. Some useful commands and ideas that could be used in the func- tion. (If you have not seen these commands before use the MAT- lab help facility or experiment on the command line) . load creates an array from a data file. xy(:,1) refers to all elements in the first column of the ar ray xy, similarly xy(: ,2) refers to the second column. . plot(x,y) plots a curve through points (xi,yi),... (x yn) . plot(x,y,'*') draws a point plot; further such triples in the argument of the plot command will plot further curves. Model the bacteria growth by the equation yt -10 exp(2.386t), where yt is the number of bacteria present at time t and t is the elapsed time in hours
Step by Step Solution
There are 3 Steps involved in it
Step: 1

See step-by-step solutions with expert insights and AI powered tools for academic success
Step: 2

Step: 3

Ace Your Homework with AI
Get the answers you need in no time with our AI-driven, step-by-step assistance
Get Started


