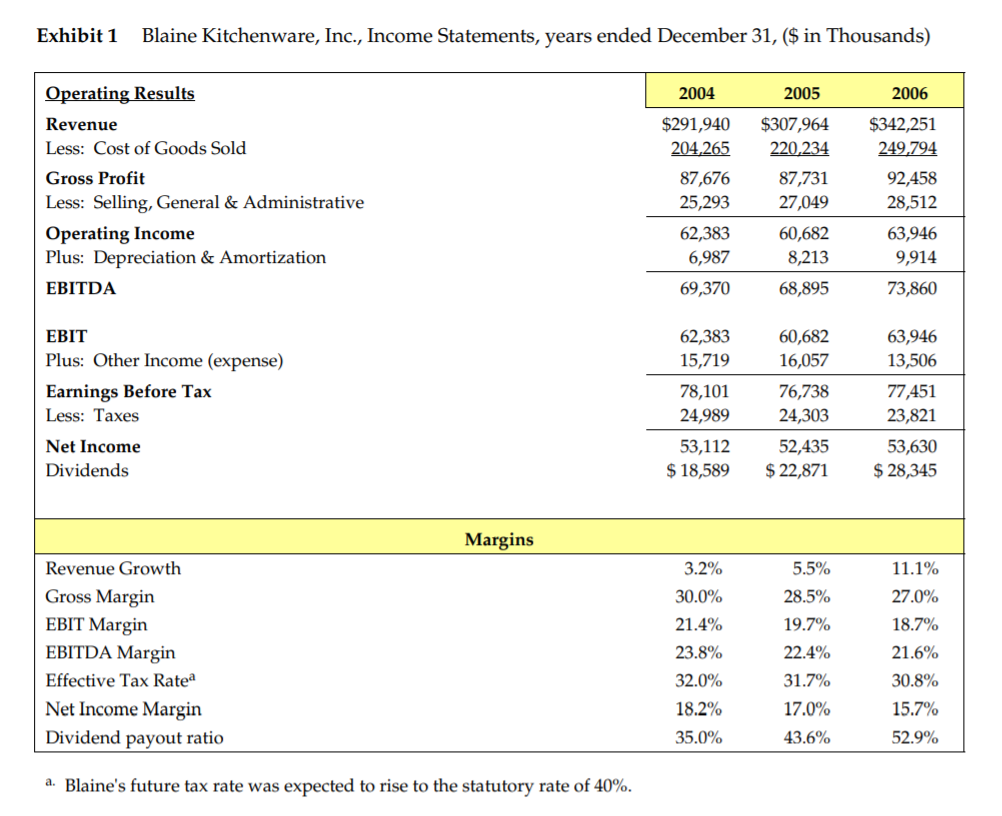
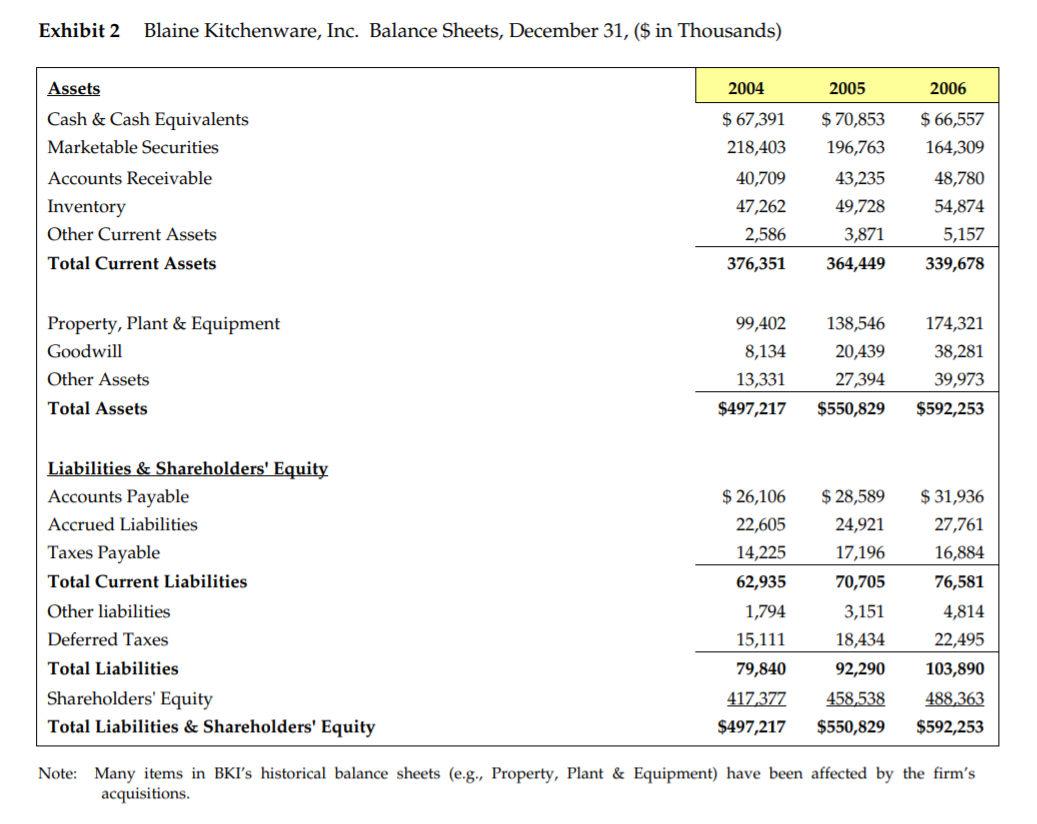
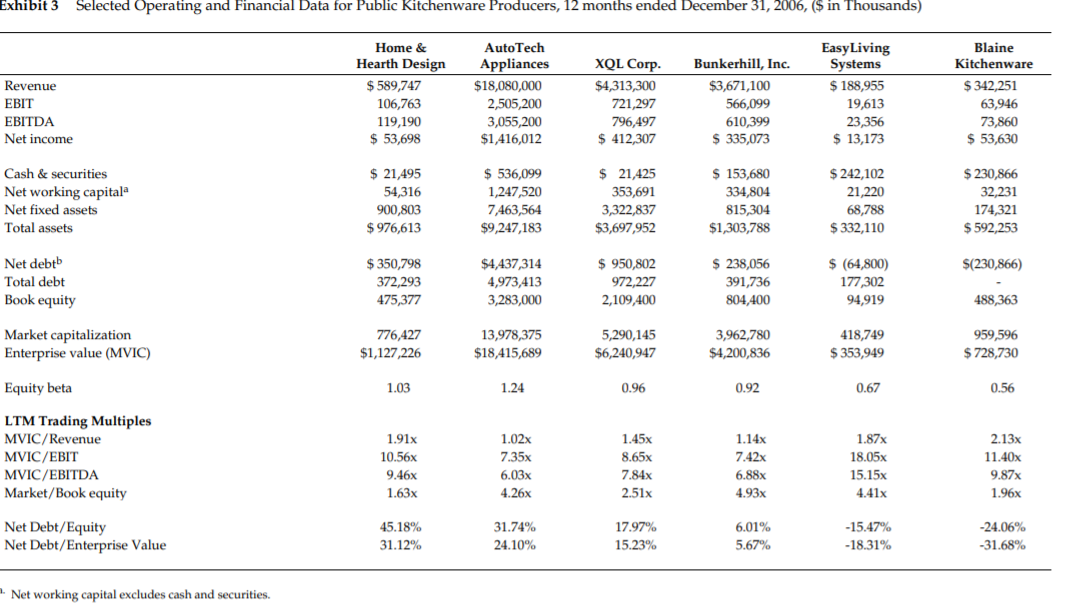
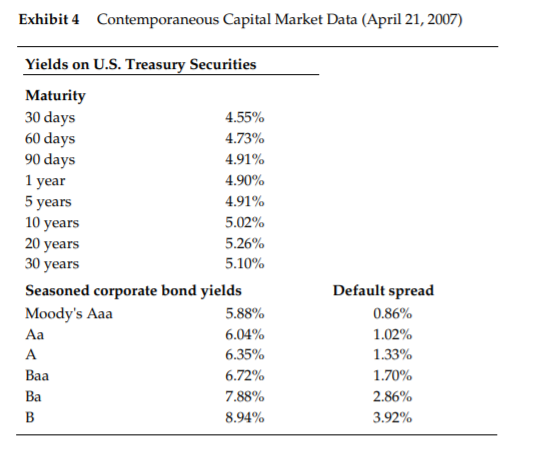
Exhibit 1 Blaine Kitchenware, Inc., Income Statements, years ended December 31, ($ in Thousands) 2004 2005 2006 Operating Results Revenue Less: Cost of Goods Sold Gross Profit Less: Selling, General & Administrative Operating Income Plus: Depreciation & Amortization EBITDA $291,940 204,265 87,676 25,293 $307,964 220,234 87,731 27,049 60,682 8,213 $342,251 249.794 92,458 28,512 63,946 9,914 73,860 62,383 6,987 69,370 68,895 EBIT Plus: Other Income (expense) Earnings Before Tax Less: Taxes 62,383 15,719 78,101 24,989 53,112 $ 18,589 60,682 16,057 76,738 24,303 52,435 $ 22,871 63,946 13,506 77,451 23,821 53,630 $ 28,345 Net Income Dividends Margins Revenue Growth Gross Margin EBIT Margin EBITDA Margin Effective Tax Ratea Net Income Margin Dividend payout ratio 3.2% 30.0% 21.4% 23.8% 32.0% 5.5% 28.5% 19.7% 22.4% 31.7% 17.0% 43.6% 11.1% 27.0% 18.7% 21.6% 30.8% 15.7% 52.9% 18.2% 35.0% a. Blaine's future tax rate was expected to rise to the statutory rate of 40%. Exhibit 2 Blaine Kitchenware, Inc. Balance Sheets, December 31, ($ in Thousands) 2004 2005 2006 Assets Cash & Cash Equivalents Marketable Securities Accounts Receivable Inventory Other Current Assets Total Current Assets $ 67,391 218,403 40,709 47,262 2,586 376,351 $ 70,853 196,763 43,235 49,728 3,871 364,449 $ 66,557 164,309 48,780 54,874 5,157 339,678 Property, Plant & Equipment Goodwill Other Assets 99,402 8,134 13,331 $497,217 138,546 20,439 27,394 $550,829 174,321 38,281 39,973 $592,253 Total Assets Liabilities & Shareholders' Equity Accounts Payable Accrued Liabilities Taxes Payable Total Current Liabilities Other liabilities Deferred Taxes Total Liabilities Shareholders' Equity Total Liabilities & Shareholders' Equity $ 26,106 22,605 14,225 62,935 1,794 15,111 79,840 417 377 $497,217 $ 28,589 24,921 17,196 70,705 3,151 18,434 92,290 458,538 $550,829 $ 31,936 27,761 16,884 76,581 4,814 22,495 103,890 488,363 $592,253 Note: Many items in BKI's historical balance sheets (e.g., Property, Plant & Equipment) have been affected by the firm's acquisitions. Exhibit 3 Selected Operating and Financial Data for Public Kitchenware Producers, 12 months ended December 31, 2006, ($ in Thousands) Revenue EBIT EBITDA Net income Home & Hearth Design $589,747 106,763 119,190 $ 53,698 AutoTech Appliances $18,080,000 2,505,200 3,055,200 $1,416,012 XQL Corp. $4,313,300 721,297 796,497 $ 412,307 Bunkerhill, Inc. $3,671,100 566,099 610,399 $ 335,073 Easy Living Systems $ 188,955 19,613 23,356 $ 13,173 Blaine Kitchenware $ 342,251 63,946 73,860 $ 53,630 Cash & securities Net working capital Net fixed assets Total assets $ 21,495 54,316 900,803 $976,613 $ 536,099 1,247,520 7,463,564 $9,247,183 $ 21,425 353,691 3,322,837 $3,697,952 $ 153,680 334,804 815,304 $1,303,788 $ 242,102 21,220 68,788 $ 332,110 $ 230,866 32,231 174,321 $592,253 Net debtb Total debt $ 350,798 $(230,866) $4,437,314 4,973,413 3,283,000 372,293 475,377 $ 950,802 972 227 2,109,400 $ 238,056 391,736 804,400 $ (64,800) 177,302 94,919 Book equity 488,363 Market capitalization Enterprise value (MVIC) 776,427 $1,127,226 13,978,375 $18,415,689 5,290,145 $6,240,947 3,962,780 $4,200,836 418,749 $ 353,949 959,596 $ 728,730 Equity beta 1.03 1.24 0.96 0.92 0.67 0.56 1.02x LTM Trading Multiples MVIC/Revenue MVIC/EBIT MVIC/EBITDA Market/Book equity 7.35% 1.91x 10.56% 9.46x 1.63x 1.45x 8.65x 7.84x 2.51x 1.14x 7.42x 6.88x 4.93x 1.87x 18.05x 15.15x 4.41x 2.13x 11.40x 9.87x 1.96x 6.03x 4.26x Net Debt/Equity Net Debt/Enterprise Value 45.18% 31.12% 31.74% 24.10% 17.97% 15.23% 6.01% 5.67% -15.47% -18.31% -24.06% -31.68% Net working capital excludes cash and securities. Exhibit 4 Contemporaneous Capital Market Data (April 21, 2007) Yields on U.S. Treasury Securities Maturity 30 days 4.55% 60 days 4.73% 90 days 4.91% 1 year 4.90% 5 years 4.91% 10 years 5.02% 20 years 5.26% 30 years 5.10% Seasoned corporate bond yields Moody's Aaa 5.88% Aa 6.04% A 6.35% Baa 6.72% Ba 7.88% B 8.94% Default spread 0.86% 1.02% 1.33% 1.70% 2.86% 3.92% BLAINE KITCHENWARE 1. Evaluate the financial performance of Blaine Kitchen Ware over the period 2004.2005 and 2006 using financial ratios and commonsize analysis. 2. Calculate Blaine Kitchenware's Free cash flow, equity cash flow and capital cash flow for 2004,2005 and 2006. 3. Estimate Blaine Kitchenware's WACC in 2006, assuming an equity risk premium of 7.0% 4. Critically evaluate Blaine Kitchenware's current capital structure and dividend policy. 5. Analyze the impact of the proposed restructuring on Blaine's 2006 financial ratios, free cash flow, equity cash flow and wacc. (prepare the 2006 statements as if the restructuring was in place and analyze the impact. 6. Assuming a constant long term growth rate of 3%, estimate Blaine's share price in 2006 and after the proposed restructuring. Exhibit 1 Blaine Kitchenware, Inc., Income Statements, years ended December 31, ($ in Thousands) 2004 2005 2006 Operating Results Revenue Less: Cost of Goods Sold Gross Profit Less: Selling, General & Administrative Operating Income Plus: Depreciation & Amortization EBITDA $291,940 204,265 87,676 25,293 $307,964 220,234 87,731 27,049 60,682 8,213 $342,251 249.794 92,458 28,512 63,946 9,914 73,860 62,383 6,987 69,370 68,895 EBIT Plus: Other Income (expense) Earnings Before Tax Less: Taxes 62,383 15,719 78,101 24,989 53,112 $ 18,589 60,682 16,057 76,738 24,303 52,435 $ 22,871 63,946 13,506 77,451 23,821 53,630 $ 28,345 Net Income Dividends Margins Revenue Growth Gross Margin EBIT Margin EBITDA Margin Effective Tax Ratea Net Income Margin Dividend payout ratio 3.2% 30.0% 21.4% 23.8% 32.0% 5.5% 28.5% 19.7% 22.4% 31.7% 17.0% 43.6% 11.1% 27.0% 18.7% 21.6% 30.8% 15.7% 52.9% 18.2% 35.0% a. Blaine's future tax rate was expected to rise to the statutory rate of 40%. Exhibit 2 Blaine Kitchenware, Inc. Balance Sheets, December 31, ($ in Thousands) 2004 2005 2006 Assets Cash & Cash Equivalents Marketable Securities Accounts Receivable Inventory Other Current Assets Total Current Assets $ 67,391 218,403 40,709 47,262 2,586 376,351 $ 70,853 196,763 43,235 49,728 3,871 364,449 $ 66,557 164,309 48,780 54,874 5,157 339,678 Property, Plant & Equipment Goodwill Other Assets 99,402 8,134 13,331 $497,217 138,546 20,439 27,394 $550,829 174,321 38,281 39,973 $592,253 Total Assets Liabilities & Shareholders' Equity Accounts Payable Accrued Liabilities Taxes Payable Total Current Liabilities Other liabilities Deferred Taxes Total Liabilities Shareholders' Equity Total Liabilities & Shareholders' Equity $ 26,106 22,605 14,225 62,935 1,794 15,111 79,840 417 377 $497,217 $ 28,589 24,921 17,196 70,705 3,151 18,434 92,290 458,538 $550,829 $ 31,936 27,761 16,884 76,581 4,814 22,495 103,890 488,363 $592,253 Note: Many items in BKI's historical balance sheets (e.g., Property, Plant & Equipment) have been affected by the firm's acquisitions. Exhibit 3 Selected Operating and Financial Data for Public Kitchenware Producers, 12 months ended December 31, 2006, ($ in Thousands) Revenue EBIT EBITDA Net income Home & Hearth Design $589,747 106,763 119,190 $ 53,698 AutoTech Appliances $18,080,000 2,505,200 3,055,200 $1,416,012 XQL Corp. $4,313,300 721,297 796,497 $ 412,307 Bunkerhill, Inc. $3,671,100 566,099 610,399 $ 335,073 Easy Living Systems $ 188,955 19,613 23,356 $ 13,173 Blaine Kitchenware $ 342,251 63,946 73,860 $ 53,630 Cash & securities Net working capital Net fixed assets Total assets $ 21,495 54,316 900,803 $976,613 $ 536,099 1,247,520 7,463,564 $9,247,183 $ 21,425 353,691 3,322,837 $3,697,952 $ 153,680 334,804 815,304 $1,303,788 $ 242,102 21,220 68,788 $ 332,110 $ 230,866 32,231 174,321 $592,253 Net debtb Total debt $ 350,798 $(230,866) $4,437,314 4,973,413 3,283,000 372,293 475,377 $ 950,802 972 227 2,109,400 $ 238,056 391,736 804,400 $ (64,800) 177,302 94,919 Book equity 488,363 Market capitalization Enterprise value (MVIC) 776,427 $1,127,226 13,978,375 $18,415,689 5,290,145 $6,240,947 3,962,780 $4,200,836 418,749 $ 353,949 959,596 $ 728,730 Equity beta 1.03 1.24 0.96 0.92 0.67 0.56 1.02x LTM Trading Multiples MVIC/Revenue MVIC/EBIT MVIC/EBITDA Market/Book equity 7.35% 1.91x 10.56% 9.46x 1.63x 1.45x 8.65x 7.84x 2.51x 1.14x 7.42x 6.88x 4.93x 1.87x 18.05x 15.15x 4.41x 2.13x 11.40x 9.87x 1.96x 6.03x 4.26x Net Debt/Equity Net Debt/Enterprise Value 45.18% 31.12% 31.74% 24.10% 17.97% 15.23% 6.01% 5.67% -15.47% -18.31% -24.06% -31.68% Net working capital excludes cash and securities. Exhibit 4 Contemporaneous Capital Market Data (April 21, 2007) Yields on U.S. Treasury Securities Maturity 30 days 4.55% 60 days 4.73% 90 days 4.91% 1 year 4.90% 5 years 4.91% 10 years 5.02% 20 years 5.26% 30 years 5.10% Seasoned corporate bond yields Moody's Aaa 5.88% Aa 6.04% A 6.35% Baa 6.72% Ba 7.88% B 8.94% Default spread 0.86% 1.02% 1.33% 1.70% 2.86% 3.92% BLAINE KITCHENWARE 1. Evaluate the financial performance of Blaine Kitchen Ware over the period 2004.2005 and 2006 using financial ratios and commonsize analysis. 2. Calculate Blaine Kitchenware's Free cash flow, equity cash flow and capital cash flow for 2004,2005 and 2006. 3. Estimate Blaine Kitchenware's WACC in 2006, assuming an equity risk premium of 7.0% 4. Critically evaluate Blaine Kitchenware's current capital structure and dividend policy. 5. Analyze the impact of the proposed restructuring on Blaine's 2006 financial ratios, free cash flow, equity cash flow and wacc. (prepare the 2006 statements as if the restructuring was in place and analyze the impact. 6. Assuming a constant long term growth rate of 3%, estimate Blaine's share price in 2006 and after the proposed restructuring